Ggplot2에서 scale_x_continuous를 사용하는 방법(예제 포함)
ggplot2의 scale_x_continuous() 함수를 사용하여 주어진 플롯의 x축을 사용자 정의할 수 있습니다.
이 함수는 다음 기본 구문을 사용합니다.
 p+
scale_x_continuous(breaks, n.breaks, labels, limits, ...)
금:
- break : x축의 브레이크 위치에 대한 숫자 벡터입니다.
- n.breaks : x축의 총 나누기 수를 지정하는 정수 벡터
- labels : x축에 사용할 레이블의 문자형 벡터
- 제한 : x축의 최소값과 최대값을 지정하는 숫자형 벡터
다음 예에서는 R의 다음 데이터 프레임을 사용하여 다양한 시나리오에서 이 함수를 사용하는 방법을 보여줍니다.
 #create data frame
df <- data. frame (points=c(5, 7, 12, 13, 15, 19, 22, 25),
                 assists=c(4, 3, 2, 3, 7, 8, 5, 7))

#view data frame
df

  assist points
1 5 4
2 7 3
3 12 2
4 13 3
5 15 7
6 19 8
7 22 5
8 25 7
예 1: 사용자 정의 축 나누기와 함께 scale_x_continuous 사용
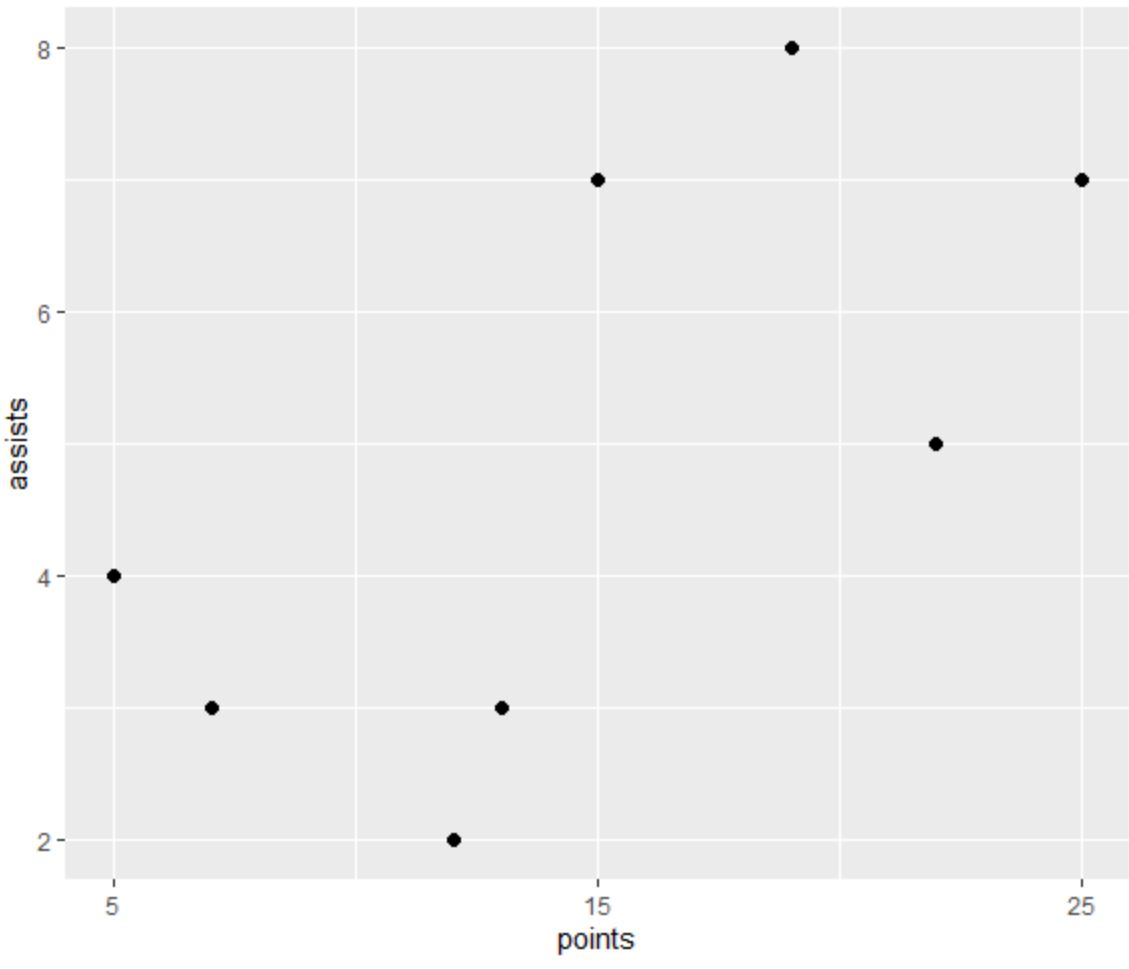
다음 코드는 ggplot2에서 산점도를 생성하고 중단 인수와 함께 scale_x_continuous()를 사용하여 사용자 정의 축 나누기를 5, 15 및 25로 지정하는 방법을 보여줍니다.
 library (ggplot2)

#create scatterplot with custom x-axis breaks
ggplot(df, aes(x=points, y=assists)) +
  geom_point(size= 2 ) +
  scale_x_continuous(breaks=c(5, 15, 25))

x축에는 break 인수를 사용하여 지정한 대로 5, 15, 25의 축 나누기만 포함됩니다.
예시 2: 맞춤 일시중지 횟수와 함께 scale_x_continuous 사용
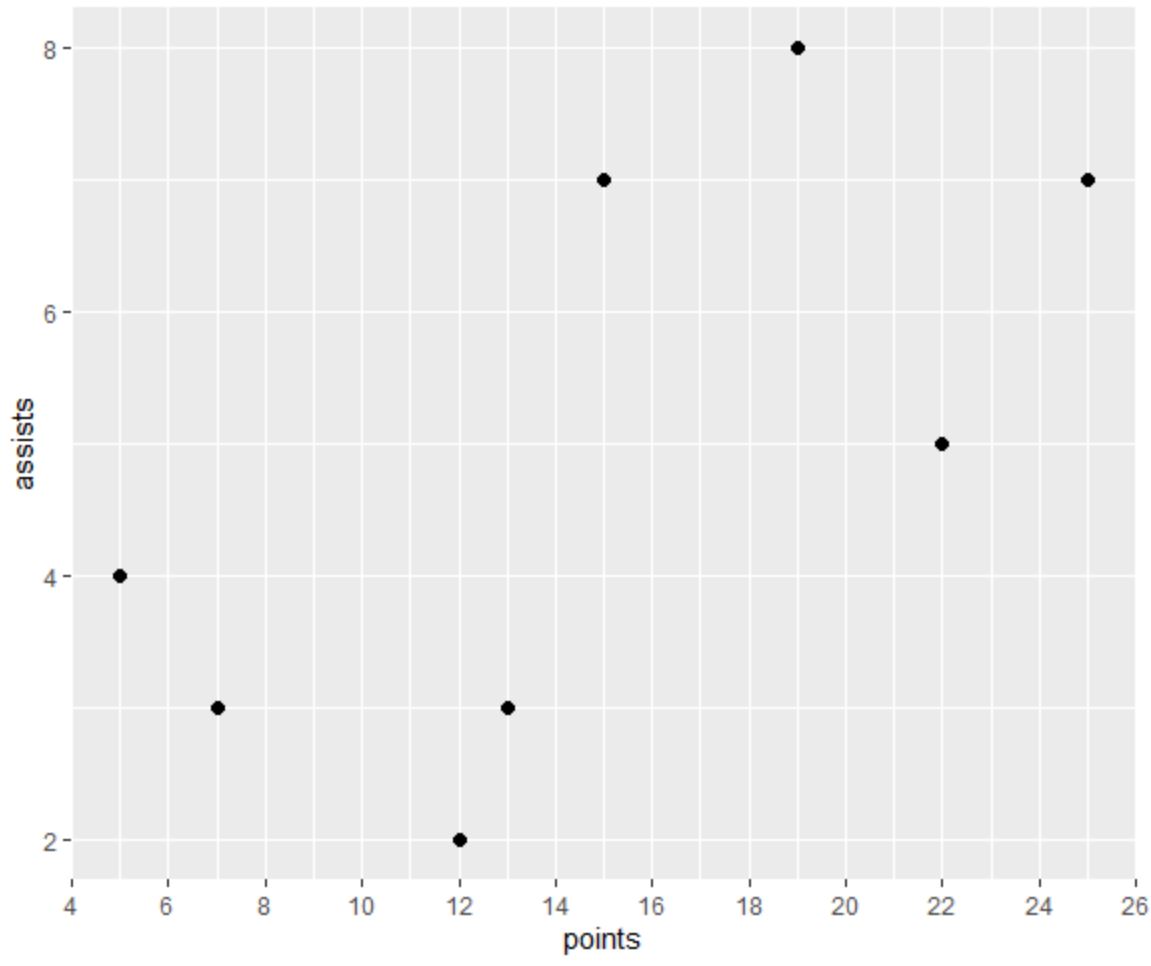
다음 코드는 ggplot2에서 분산형 차트를 생성하고 n.breaks 인수와 함께 scale_x_continuous()를 사용하여 x축에 정확히 12개의 축 나누기를 배치하는 방법을 보여줍니다.
 library (ggplot2)

#create scatterplot with custom number of breaks on x-axis
ggplot(df, aes(x=points, y=assists)) +
  geom_point(size= 2 ) +
  scale_x_continuous(n. breaks = 12 )

n.breaks 인수를 사용하여 지정한 대로 x축에는 정확히 12개의 축 나누기가 포함됩니다.
예시 3: 맞춤 라벨과 함께 scale_x_continuous 사용
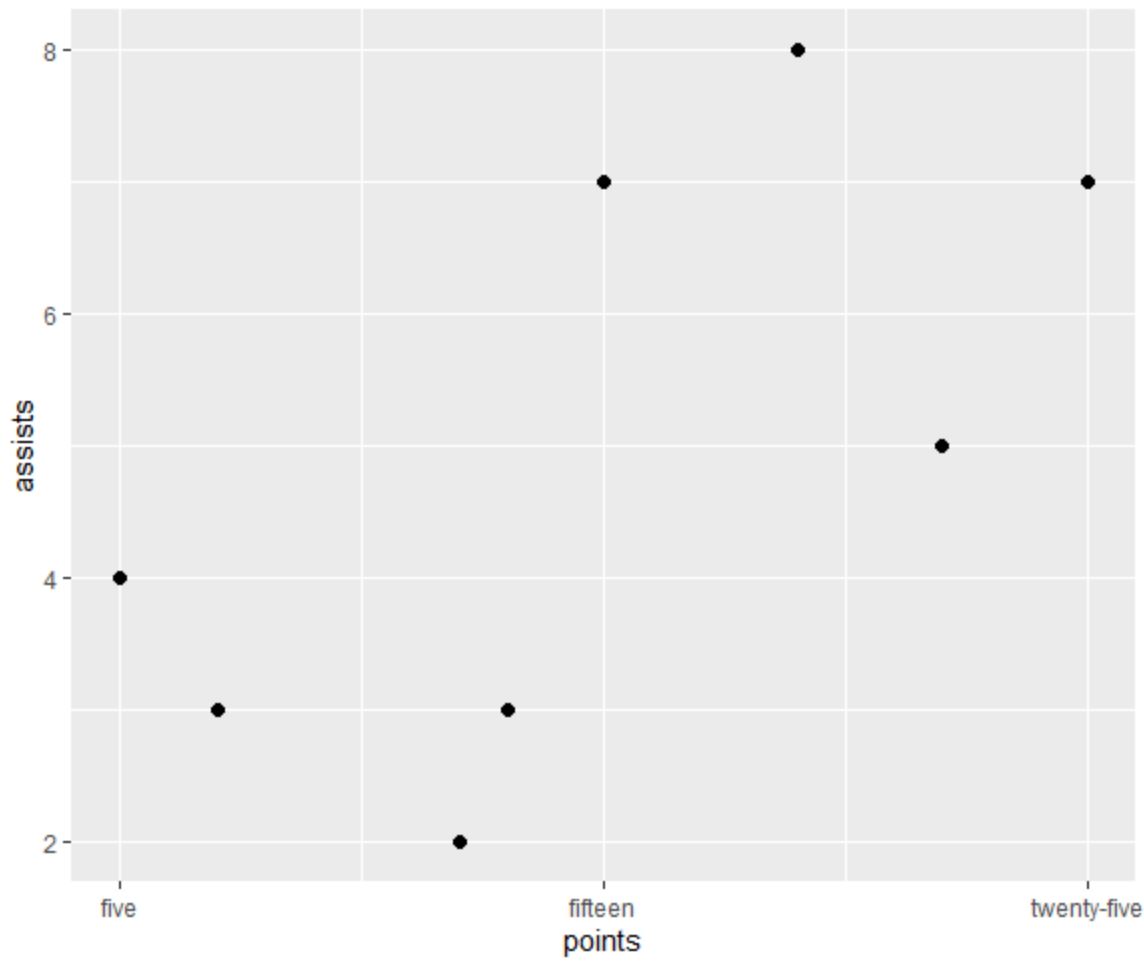
다음 코드는 ggplot2에서 산점도를 생성하고 scale_x_continuous()를 labels 인수와 함께 사용하여 x축에 배치할 레이블 이름을 지정하는 방법을 보여줍니다.
 library (ggplot2)

#create scatterplot with custom labels on x-axis
ggplot(df, aes(x=points, y=assists)) +
  geom_point(size= 2 ) +
  scale_x_continuous(breaks=c(5, 15, 25), labels=c(' five ', ' fifteen ', ' twenty-five '))

x축에는 labels 인수를 사용하여 지정한 대로 각각 맞춤 라벨이 있는 3개의 축 나누기가 포함되어 있습니다.
예시 4: 사용자 정의 제한과 함께 scale_x_continuous 사용
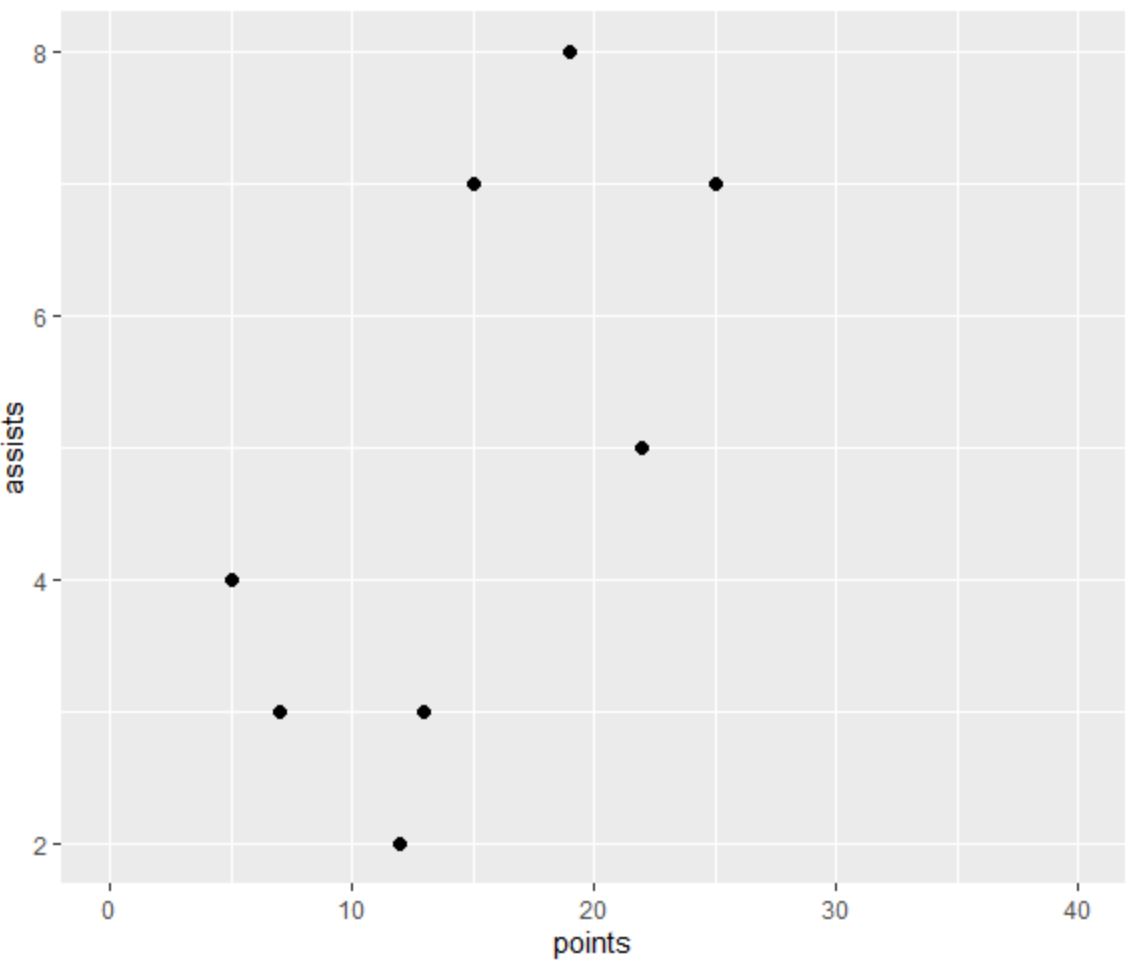
다음 코드는 ggplot2에서 분산형 차트를 생성하고 scale_x_continuous()를 제한 인수와 함께 사용하여 x축에 0과 40의 사용자 지정 제한을 지정하는 방법을 보여줍니다.
 library (ggplot2)

#create scatterplot with custom x-axis limits
ggplot(df, aes(x=points, y=assists)) +
  geom_point(size= 2 ) +
  scale_x_continuous(limits=c( 0 , 40 ))

x축은 우리가 제한 인수를 사용하여 지정한 대로 0에서 40까지입니다.
추가 리소스
다음 튜토리얼에서는 ggplot2에서 다른 일반적인 작업을 수행하는 방법을 설명합니다.
ggplot2에서 scale_y_continuous를 사용하는 방법
ggplot2에서 축 레이블을 회전하는 방법
ggplot2에서 범례 레이블을 변경하는 방법