Ggplot2에서 축 제한을 설정하는 방법
ggplot2를 사용하여 플롯에 축 제한을 설정하려는 경우가 종종 있습니다. 다음 기능을 사용하면 쉽게 이 작업을 수행할 수 있습니다.
- xlim() : x축의 하한과 상한을 지정합니다.
- ylim(): y축의 하한과 상한을 지정합니다.
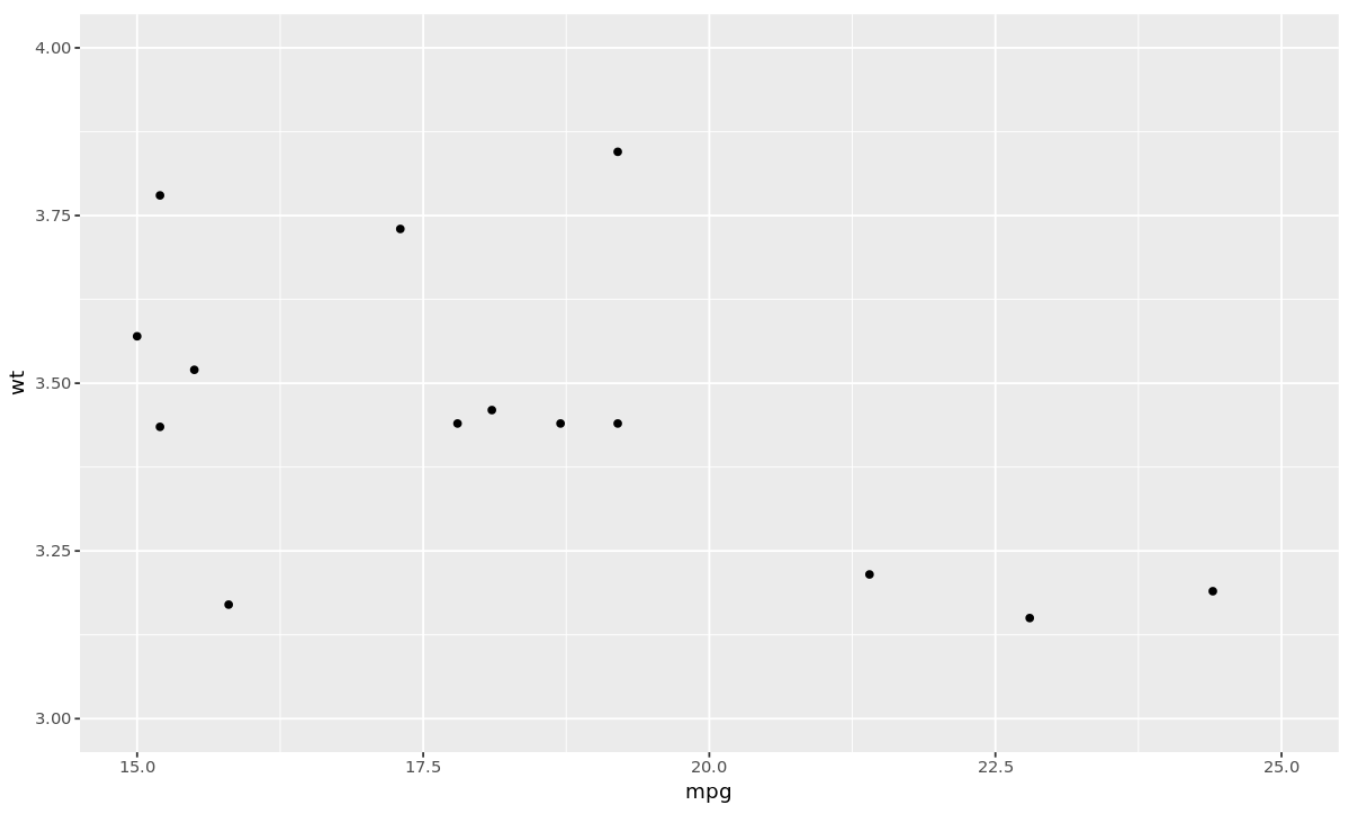
이 두 가지 방법 모두 경계 외부의 데이터를 제거하므로 때로는 의도하지 않은 결과가 발생할 수 있습니다. 데이터 관찰을 제거하지 않고 축 경계를 변경하려면 coord_cartesian()을 사용할 수 있습니다.
- coord_cartesian(): 관측치를 제거하지 않고 x축과 y축 경계를 지정합니다.
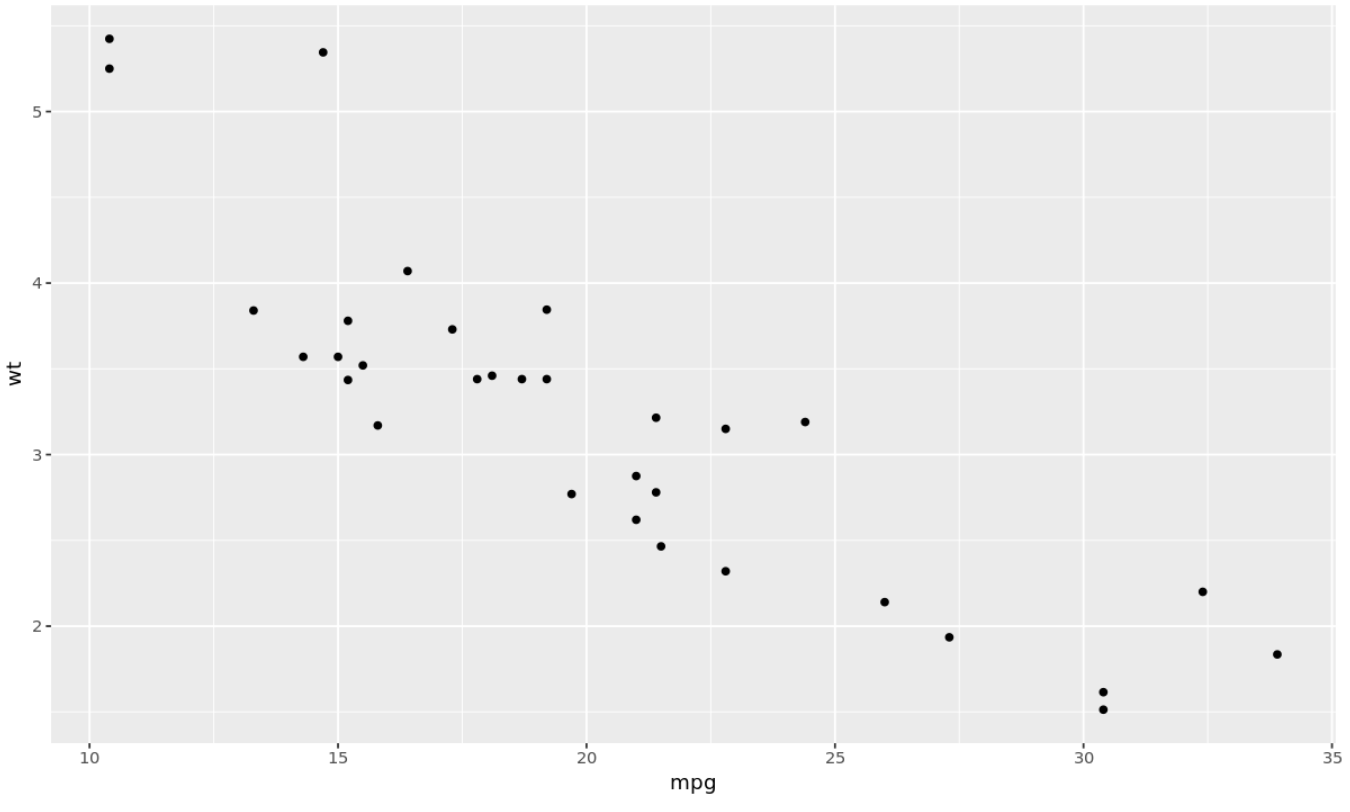
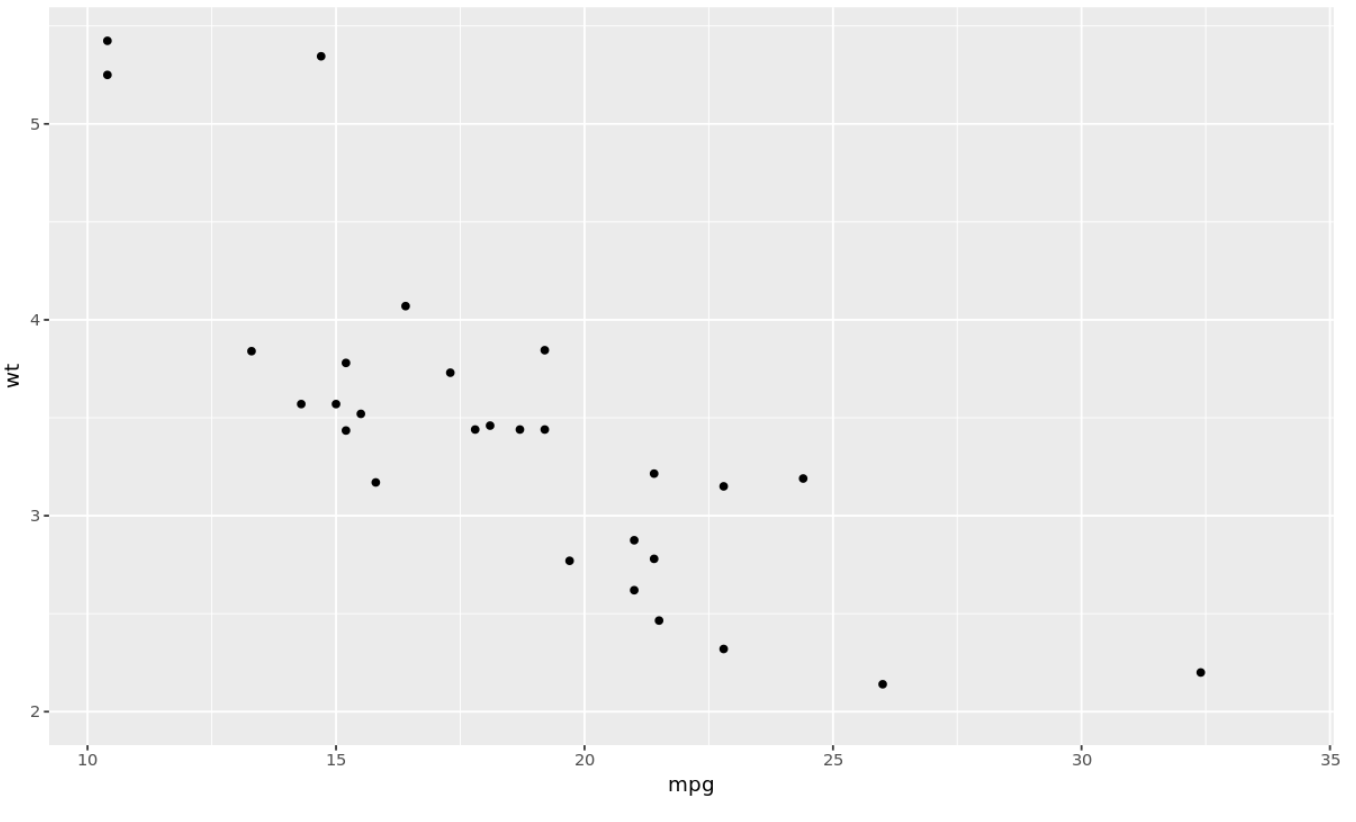
이 튜토리얼에서는 mtcars 임베디드 R 데이터세트로 만든 다음 산점도를 사용하여 이러한 함수를 사용하는 여러 가지 방법을 설명합니다.
 #load ggplot2
library(ggplot2)

#create scatterplot
ggplot(mtcars, aes(mpg, wt)) +
  geom_point()
예 1: xlim()을 사용하여 X축 제한 설정
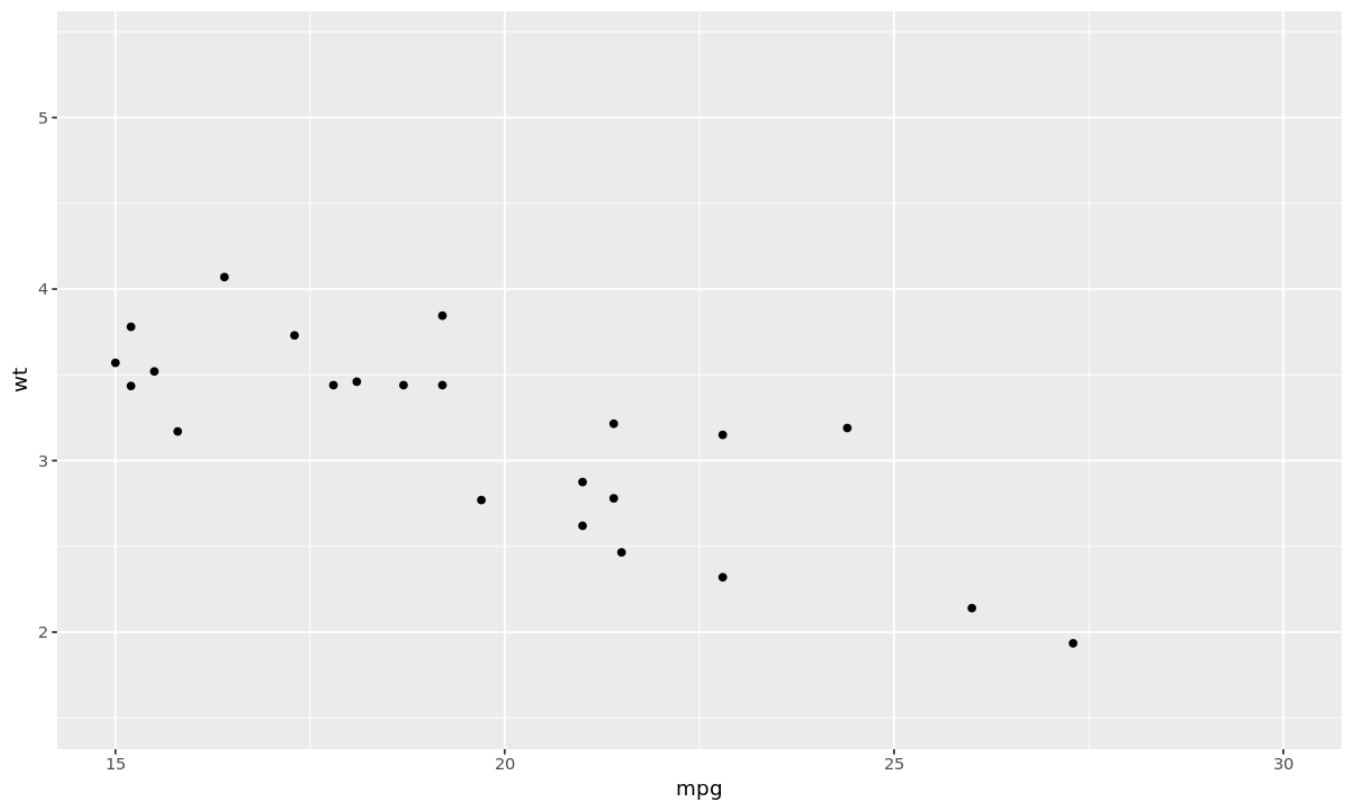
다음 코드는 xlim() 함수를 사용하여 산점도의 X축 제한을 설정하는 방법을 보여줍니다.
 #create scatterplot with x-axis ranging from 15 to 30
ggplot(mtcars, aes(mpg, wt)) +
  geom_point() +
  xlim (15, 30)

Warning message:
“Removed 9 rows containing missing values (geom_point).”
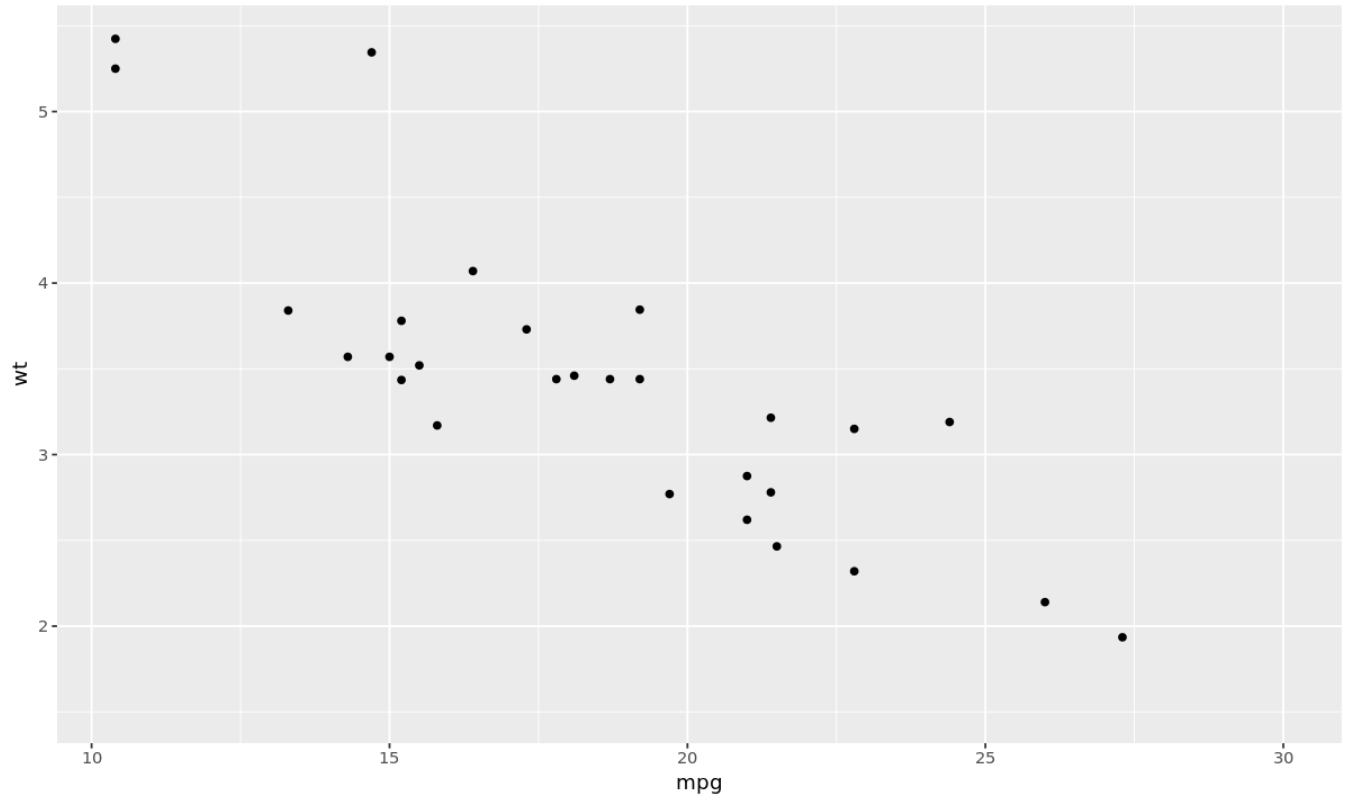
NA를 사용하여 x축의 상한만 설정하고 ggplot2가 하한을 자동으로 선택하도록 할 수도 있습니다.
 #create scatterplot with x-axis upper limit at 30
ggplot(mtcars, aes(mpg, wt)) +
  geom_point() +
  xlim ( NA , 30)

Warning message:
“Removed 4 rows containing missing values (geom_point).”
예 2: ylim()을 사용하여 Y축 제한 설정
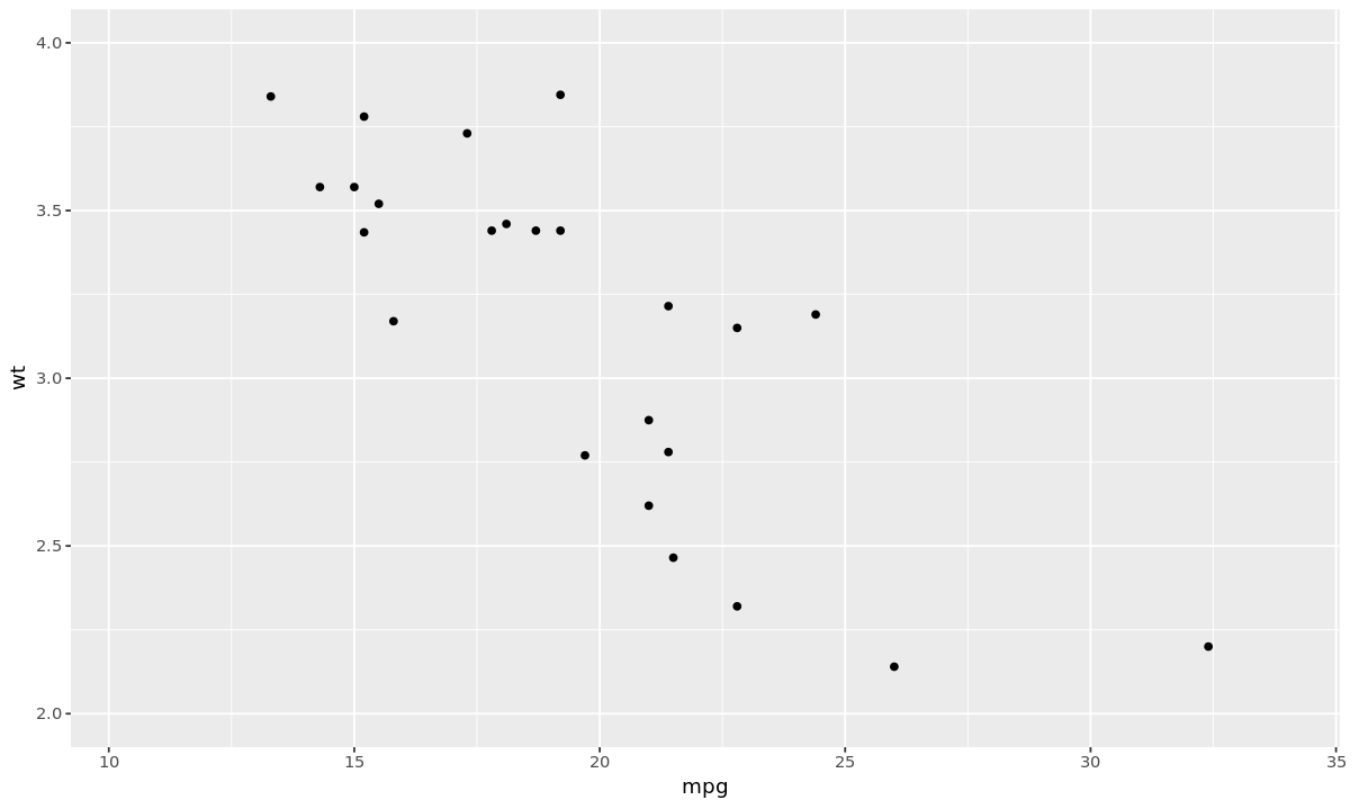
다음 코드는 ylim() 함수를 사용하여 산점도의 y축 경계를 설정하는 방법을 보여줍니다.
 #create scatterplot with y-axis ranging from 2 to 4
ggplot(mtcars, aes(mpg, wt)) +
  geom_point() +
  ylim (2, 4)

Warning message:
“Removed 8 rows containing missing values (geom_point).”
NA를 사용하여 y축의 하한만 설정하고 ggplot2가 자동으로 상한을 선택하도록 할 수도 있습니다.
 #create scatterplot with y-axis lower limit at 2
ggplot(mtcars, aes(mpg, wt)) +
  geom_point() +
  xlim (2, NA )

Warning message:
“Removed 4 rows containing missing values (geom_point).”
예 3: Coordinate_cartesian()을 사용하여 축 제한 설정
다음 코드는 coord_cartesian() 함수를 사용하여 산점도의 y축 경계를 설정하는 방법을 보여줍니다.
 #create scatterplot with y-axis ranging from 2 to 4
ggplot(mtcars, aes(mpg, wt)) +
  geom_point() +
  coord_cartesian(xlim =c (15, 25) , ylim = c (3, 4) )
여기에서 더 많은 ggplot2 튜토리얼을 찾을 수 있습니다.