Matplotlib 플롯에 눈금선을 표시하는 방법
기본적으로 Matplotlib은 플롯에 눈금선을 표시하지 않습니다. 그러나 matplotlib.pyplot.grid() 함수를 사용하면 플롯의 눈금선을 쉽게 표시하고 사용자 정의할 수 있습니다.
이 튜토리얼에서는 이 기능의 실제 사용 예를 보여줍니다.
Matplotlib의 기본 산점도
다음 코드는 Matplotlib를 사용하여 간단한 산점도를 만드는 방법을 보여줍니다.
 import matplotlib.pyplot as plt

#createdata
x = [1, 2, 3, 4, 5]
y = [20, 25, 49, 88, 120]

#create scatterplot of data
plt. scatter (x,y)
plt. show ()
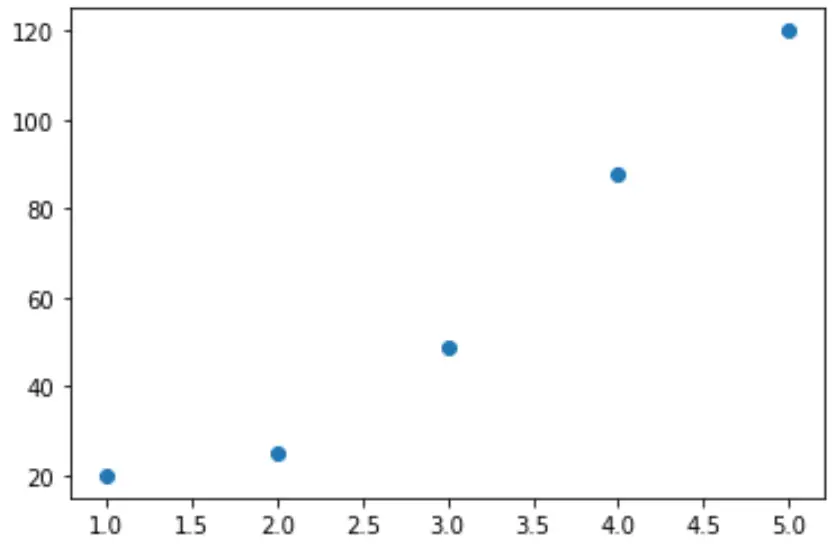
두 축에 눈금선 추가
플롯에 그리드를 추가하려면 plt.grid(True) 명령을 사용하면 됩니다.
 import matplotlib.pyplot as plt

#create data
x = [1, 2, 3, 4, 5]
y = [20, 25, 49, 88, 120]

#create scatterplot of data with gridlines
plt. scatter (x,y)
plt. grid ( True )
plt. show ()
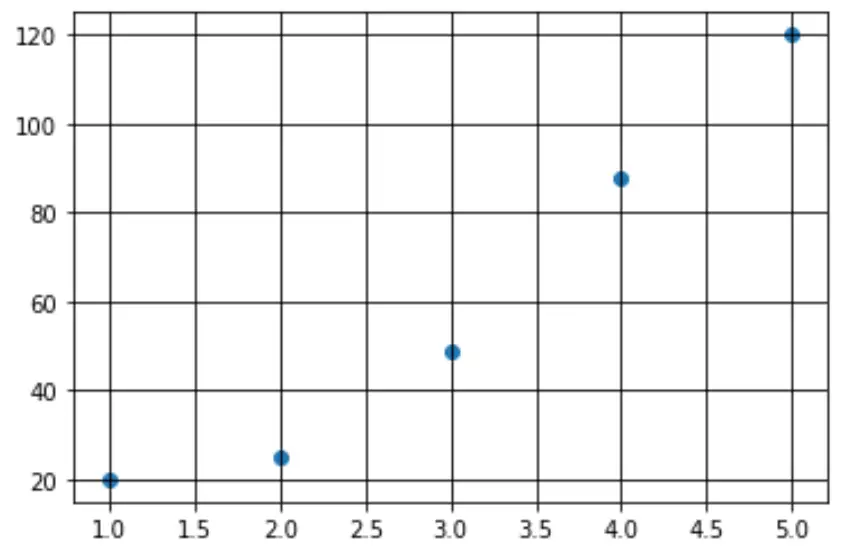
단일 축 그리드 추가
축 인수를 사용하여 x축에 눈금선만 추가할 수 있습니다.
 import matplotlib.pyplot as plt

#createdata
x = [1, 2, 3, 4, 5]
y = [20, 25, 49, 88, 120]

#create scatterplot of data with gridlines
plt. scatter (x,y)
plt. grid ( axis=' x ' )
plt. show ()
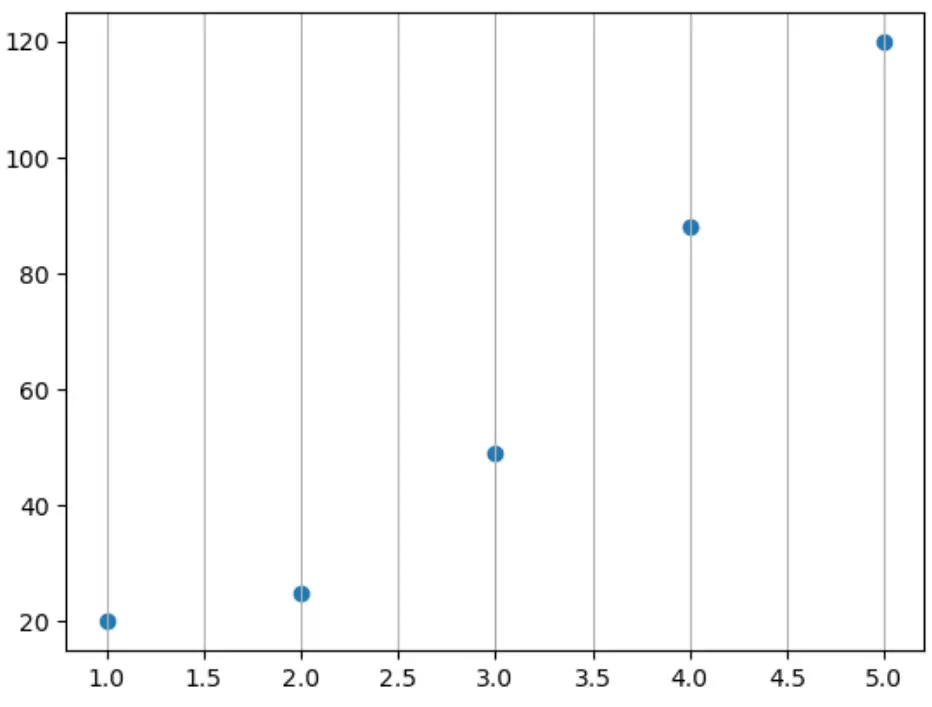
아니면 그냥 y축:
 import matplotlib.pyplot as plt

#createdata
x = [1, 2, 3, 4, 5]
y = [20, 25, 49, 88, 120]

#create scatterplot of data with gridlines
plt. scatter (x,y)
plt. grid ( axis=' y ' )
plt. show ()
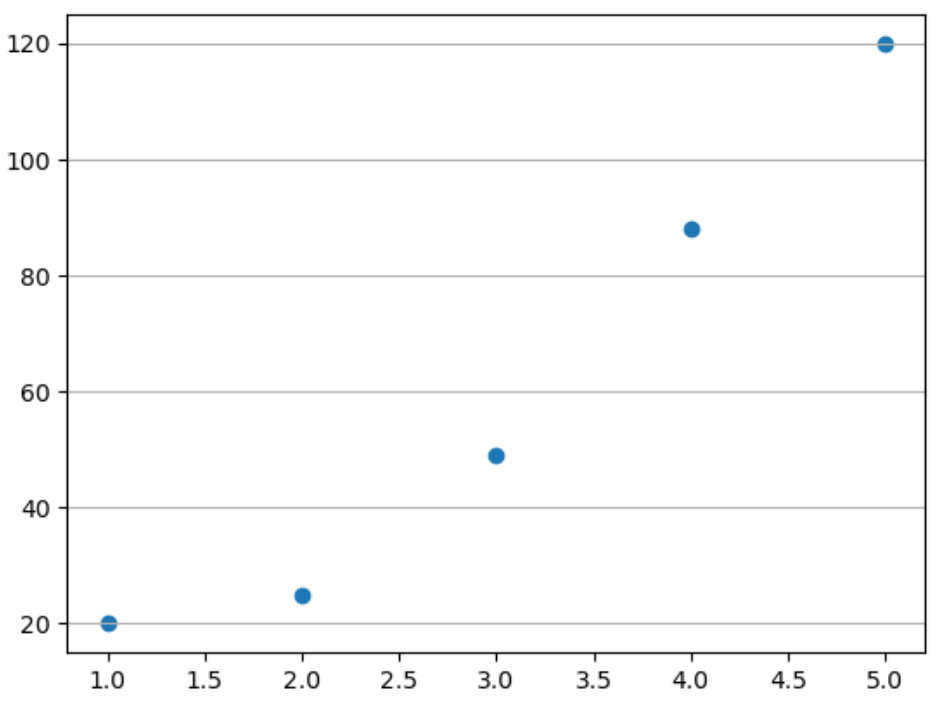
그리드 사용자 정의
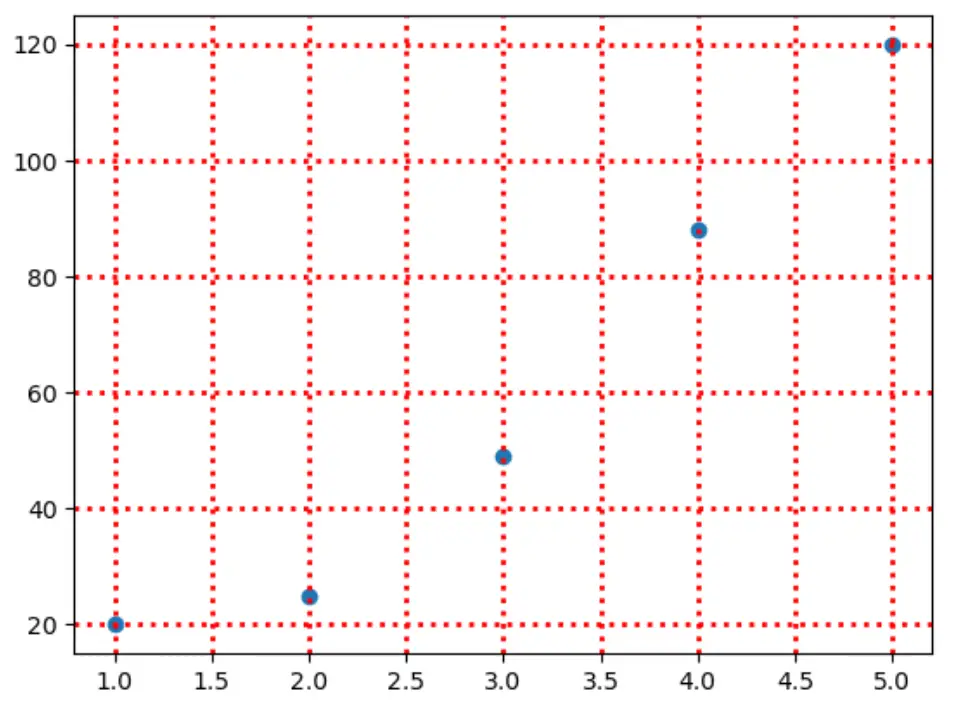
plt.rc() 함수를 사용하여 그리드의 모양을 사용자 정의할 수도 있습니다.
 import matplotlib.pyplot as plt

#create data
x = [1, 2, 3, 4, 5]
y = [20, 25, 49, 88, 120]

#create scatterplot of data with gridlines
plt. rc (' grid ', linestyle=' : ', color=' red ', linewidth= 2 )
plt. scatter (x,y)
plt. grid ( True )
plt. show ()
Matplotlib 문서 에서 눈금선을 사용자 정의하는 방법의 전체 목록을 찾을 수 있습니다.
추가 리소스
다음 튜토리얼에서는 Matplotlib에서 다른 일반적인 작업을 수행하는 방법을 설명합니다.