Matplotlib에서 범례 위치를 변경하는 방법
Matplotlib에서 범례의 위치를 변경하려면 plt.legend() 함수를 사용할 수 있습니다.
예를 들어, 다음 구문을 사용하여 플롯의 왼쪽 상단에 범례를 배치할 수 있습니다.
plt. legend (loc=' upper left ')
기본 위치는 “best”입니다. 여기서 Matplotlib은 데이터 포인트를 포함하지 않는 위치를 기반으로 범례의 위치를 자동으로 찾습니다.
그러나 다음 캡션 위치 중 하나를 지정할 수 있습니다.
- 맨 위 오른쪽
- 왼쪽 상단 모서리에
- 왼쪽 하단에
- 오른쪽 하단에
- 오른쪽
- 중앙 왼쪽
- 중앙 오른쪽
- 하단 중앙
- 상단 중앙
- 센터
bbox_to_anchor() 인수를 사용하여 범례를 플롯 외부에 배치할 수도 있습니다. 예를 들어, 다음 구문을 사용하여 플롯 외부의 오른쪽 상단 모서리에 범례를 배치할 수 있습니다.
plt. legend (bbox_to_anchor=( 1.05 , 1 ), loc=' upper left ', borderaxespad= 0 )
다음 예에서는 이러한 각 방법을 실제로 사용하는 방법을 보여줍니다.
예 1: Matplotlib 플롯 내부의 범례 위치 변경
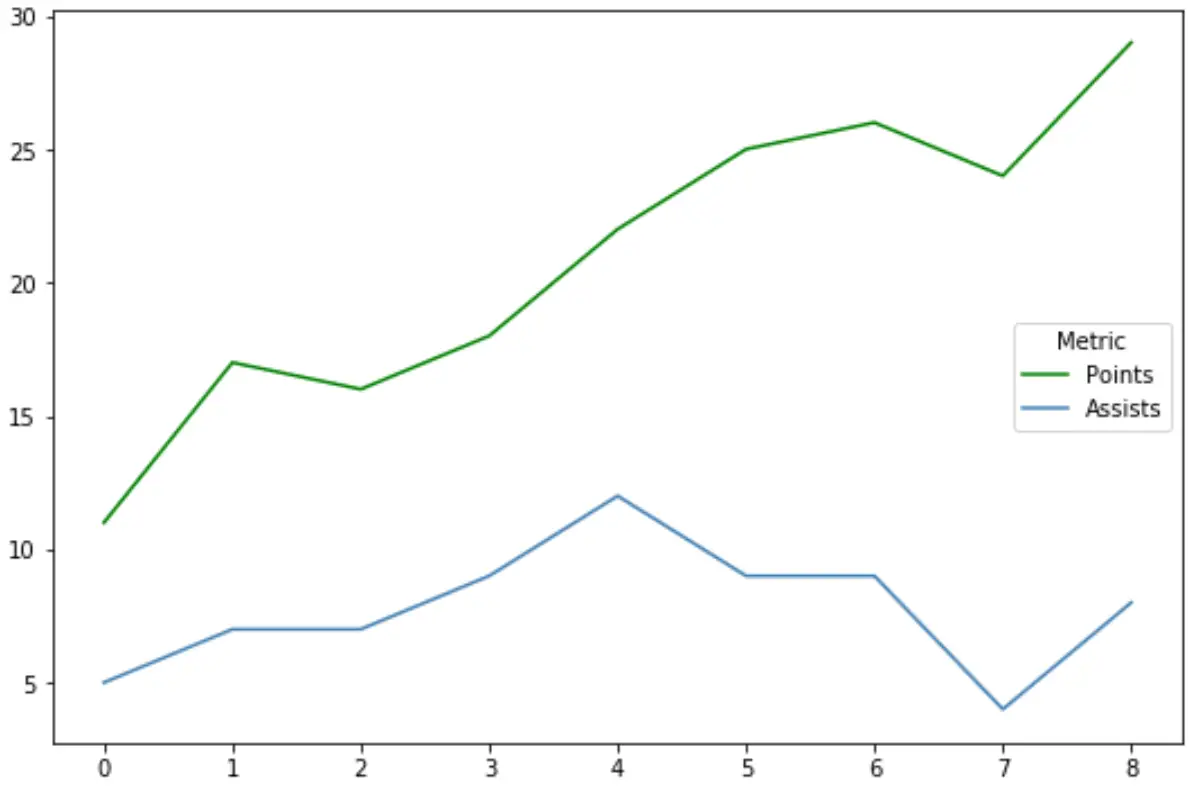
다음 코드는 Matplotlib 라인 플롯의 오른쪽 중앙 부분에 범례를 배치하는 방법을 보여줍니다.
 import pandas as pd
import matplotlib. pyplot as plt

#createdata
df = pd. DataFrame ({' points ': [11, 17, 16, 18, 22, 25, 26, 24, 29],
                   ' assists ': [5, 7, 7, 9, 12, 9, 9, 4, 8]})

#add lines to plot
plt. plot (df[' points '], label=' Points ', color=' green ')
plt. plot (df[' assists '], label=' Assists ', color=' steelblue ')

#place legend in center right of plot
plt. legend (loc=' center right ', title=' Metric ')
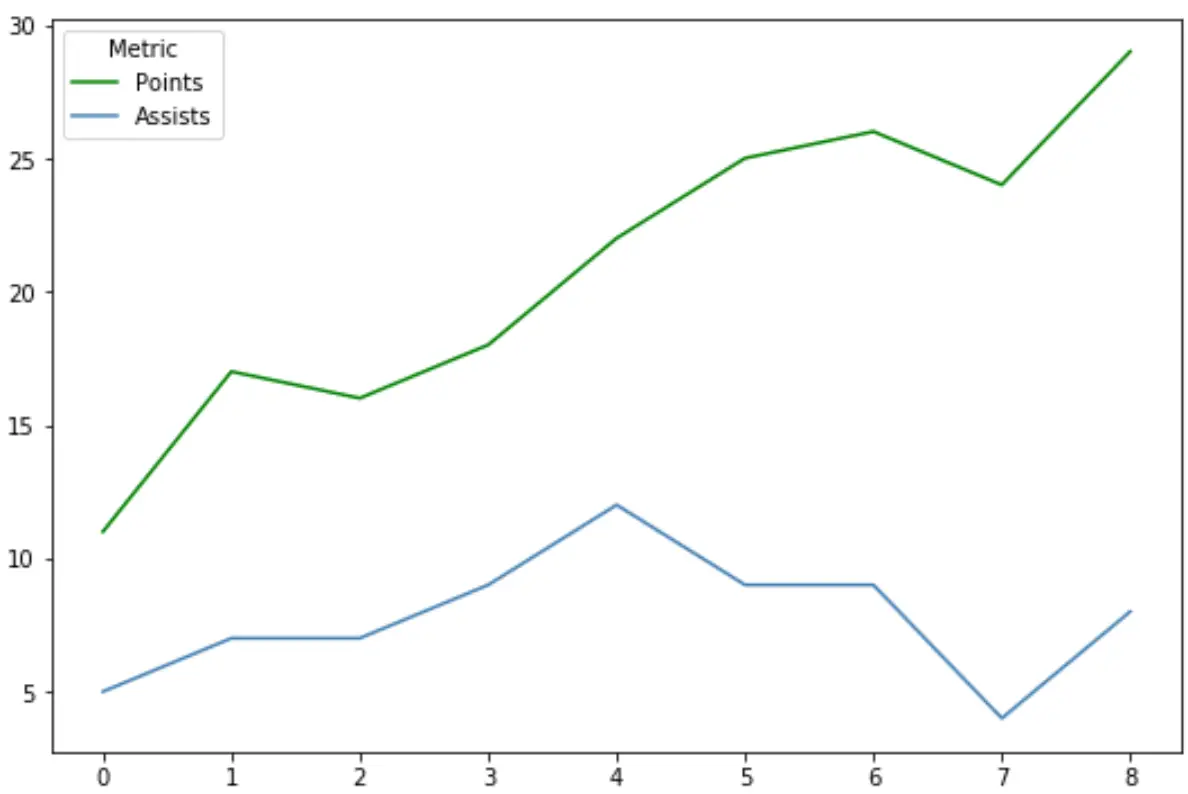
다음 코드는 Matplotlib 플롯의 왼쪽 상단에 범례를 배치하는 방법을 보여줍니다.
 import pandas as pd
import matplotlib. pyplot as plt

#create data
df = pd. DataFrame ({' points ': [11, 17, 16, 18, 22, 25, 26, 24, 29],
                   ' assists ': [5, 7, 7, 9, 12, 9, 9, 4, 8]})

#add lines to plot
plt. plot (df[' points '], label=' Points ', color=' green ')
plt. plot (df[' assists '], label=' Assists ', color=' steelblue ')

#place legend in center right of plot
plt. legend (loc=' upper left ', title=' Metric ')
예 2: Matplotlib 플롯 외부의 범례 위치 변경
Matplotlib 플롯 외부에 범례를 배치하려면 bbox_to_anchor() 인수를 사용할 수 있습니다.
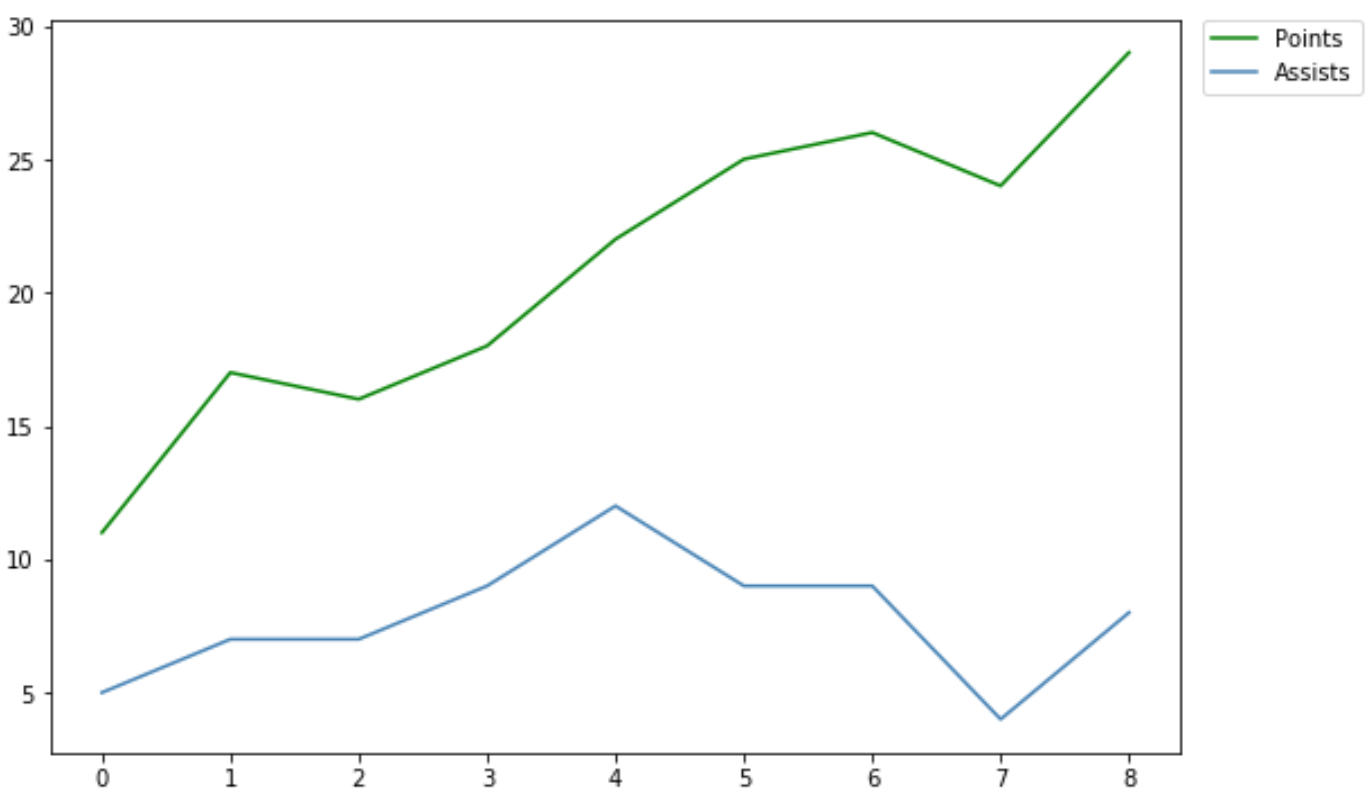
예를 들어, 플롯의 오른쪽 상단 모서리 외부에 범례를 배치하는 방법은 다음과 같습니다.
 import pandas as pd
import matplotlib. pyplot as plt

#create data
df = pd. DataFrame ({' points ': [11, 17, 16, 18, 22, 25, 26, 24, 29],
                   ' assists ': [5, 7, 7, 9, 12, 9, 9, 4, 8]})

#add lines to plot
plt. plot (df[' points '], label=' Points ', color=' green ')
plt. plot (df[' assists '], label=' Assists ', color=' steelblue ')

#place legend in center right of plot
plt. legend (bbox_to_anchor=( 1.02 , 1 ), loc=' upper left ', borderaxespad= 0 )
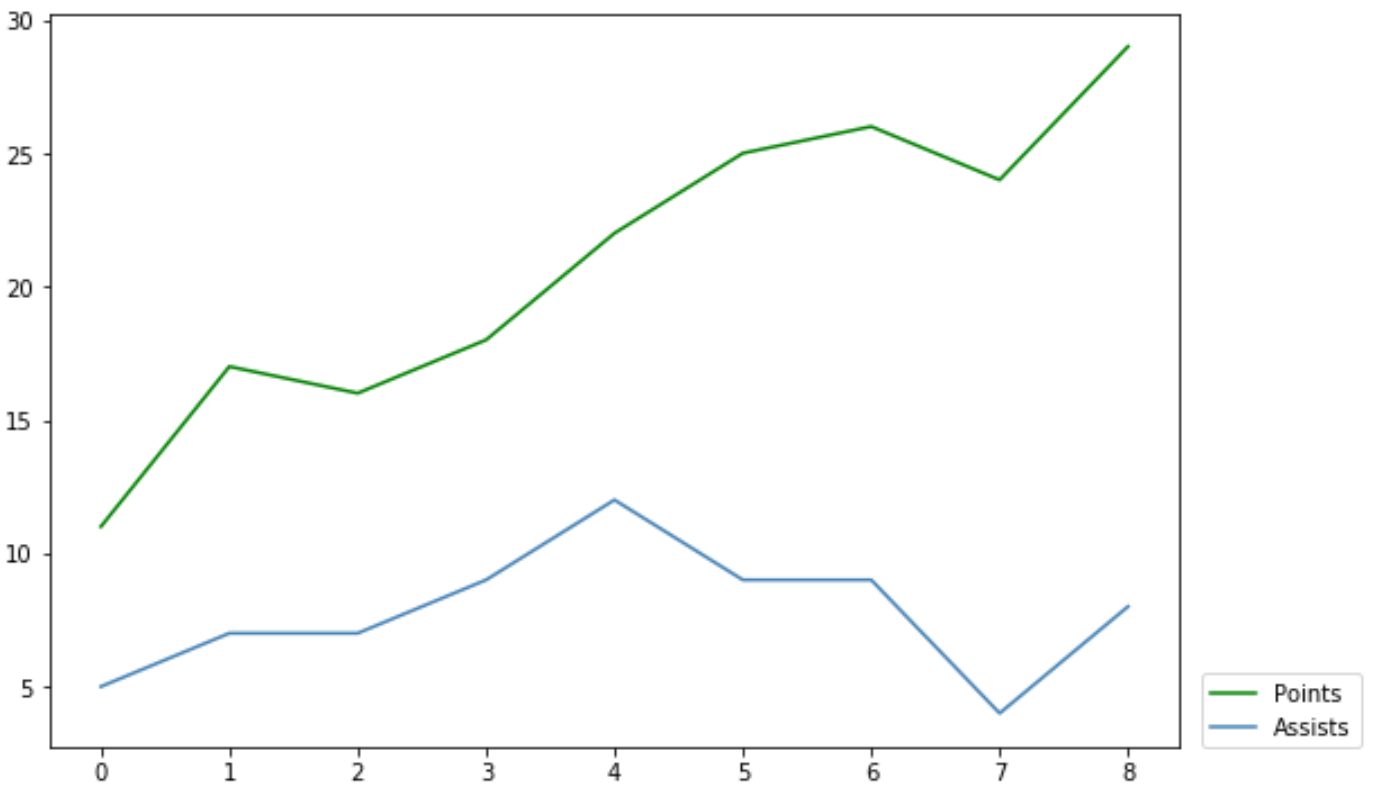
플롯의 오른쪽 하단 모서리 바깥쪽에 범례를 배치하는 방법은 다음과 같습니다.
 import pandas as pd
import matplotlib. pyplot as plt

#create data
df = pd. DataFrame ({' points ': [11, 17, 16, 18, 22, 25, 26, 24, 29],
                   ' assists ': [5, 7, 7, 9, 12, 9, 9, 4, 8]})

#add lines to plot
plt. plot (df[' points '], label=' Points ', color=' green ')
plt. plot (df[' assists '], label=' Assists ', color=' steelblue ')

#place legend in center right of plot
plt. legend (bbox_to_anchor=( 1.02 , 0.1 ), loc=' upper left ', borderaxespad= 0 )
bbox_to_anchor() 인수에 대한 자세한 설명은 matplotlib 설명서를 참조하세요.
추가 리소스
다음 튜토리얼에서는 Matplotlib에서 다른 일반적인 작업을 수행하는 방법을 설명합니다.
Matplotlib에서 범례 글꼴 크기를 변경하는 방법
Matplotlib에서 범례에 제목을 추가하는 방법
Matplotlib에서 제목 위치를 조정하는 방법
Matplotlib에서 축 레이블 위치를 조정하는 방법
저자 소개
벤자민 앤더슨
안녕하세요. 저는 통계학 교수를 퇴직하고 전임 통계 교사로 변신한 벤자민입니다. 통계 분야의 광범위한 경험과 전문 지식을 바탕으로 Statorials를 통해 학생들에게 힘을 실어주기 위해 지식을 공유하고 싶습니다. 더 알아보기