Matplotlib에서 수동 범례를 만드는 방법(예제 포함)
matplotlib.lines 및 matplotlib.patches 하위 모듈의 기능을 사용하여 matplotlib 플롯에 수동 범례를 만들 수 있습니다.
다음 예에서는 이를 수행하는 방법을 보여줍니다.
예: Matplotlib에서 수동 범례 만들기
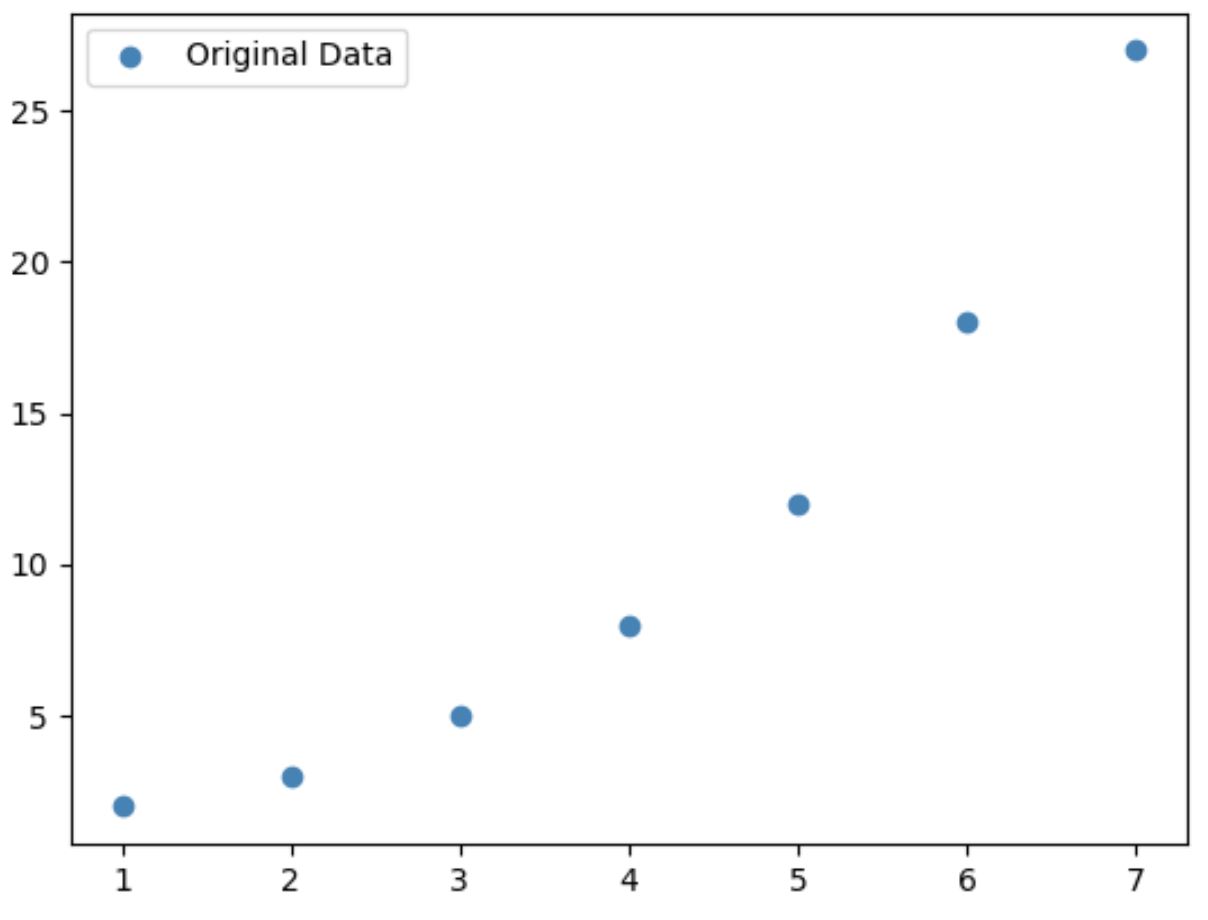
다음 코드는 기본 범례를 사용하여 matplotlib에서 산점도를 생성하는 방법을 보여줍니다.
 import matplotlib. pyplot as plt

#define data to plot
x = [1, 2, 3, 4, 5, 6, 7]
y = [2, 3, 5, 8, 12, 18, 27]

#create scatter plot of x vs. y
plt. scatter (x, y, label=' Original Data ', color=' steelblue ')

#add legend
plt. legend ()

#displayplot
plt. show ()
사용자 지정 선과 사각형이 포함된 수동 범례를 만들려면 matplotlib.lines 및 matplotlib.patches 하위 모듈을 가져와야 합니다.
다음 코드는 이러한 하위 모듈을 사용하여 수동 범례를 만드는 방법을 보여줍니다.
 import matplotlib. pyplot as plt
from matplotlib. lines import Line2D
import matplotlib. patches as mpatches

#define data to plot
x = [1, 2, 3, 4, 5, 6, 7]
y = [2, 3, 5, 8, 12, 18, 27]

#create scatter plot of x vs. y
plt. scatter (x, y, label=' Original Data ', color=' steelblue ')

#define handles and labels that will get added to legend
handles, labels = plt. gca (). get_legend_handles_labels ()

#define patches and lines to add to legend
patch1 = mpatches. Patch (color=' orange ', label=' First Manual Patch ')
patch2 = mpatches. Patch (color=' orange ', label=' First Manual Patch ')
line1 = Line2D([0], [0], label=' First Manual Line ', color=' purple ')
line2 = Line2D([0], [0], label=' Second Manual Line ', color=' red ')

#add handles
handles. extend ([patch1, line1, line2])

#add legend
plt. legend (handles=handles)

#displayplot
plt. show ()
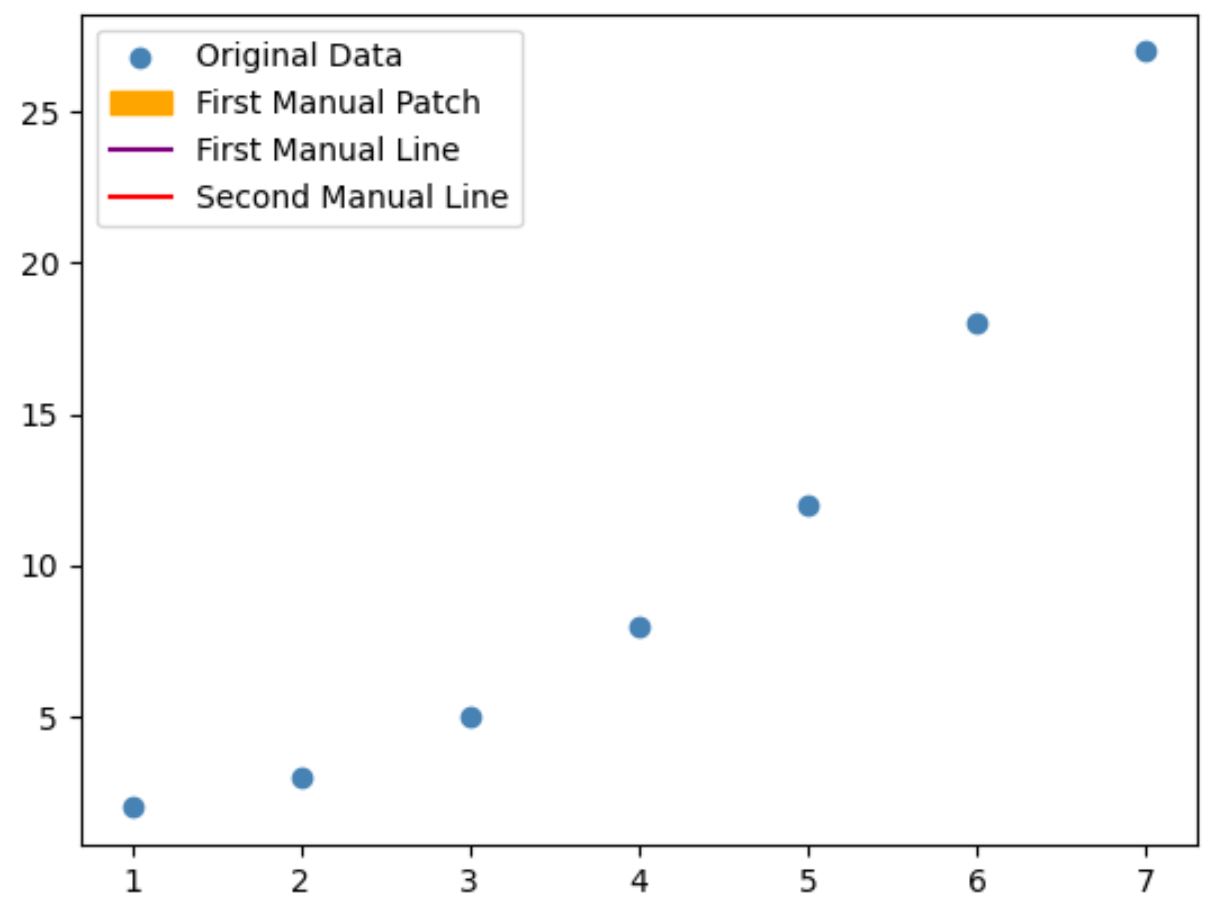
이 범례에는 원본 데이터의 레이블뿐만 아니라 수동으로 추가한 요소의 레이블과 모양도 포함되어 있습니다.
요소의 레이블이나 색상을 변경하려면 이전 코드 부분의 레이블 및 색상 인수 값을 변경하면 됩니다.
참고 : 플롯에서 범례의 위치를 변경하는 방법을 알아보려면 이 튜토리얼을 참조하십시오.
추가 리소스
다음 튜토리얼에서는 Matplotlib에서 다른 일반적인 작업을 수행하는 방법을 설명합니다.
Matplotlib에서 플롯 크기를 늘리는 방법
Matplotlib에서 제목 위치를 조정하는 방법
Matplotlib에서 축 범위를 설정하는 방법
저자 소개
벤자민 앤더슨
안녕하세요. 저는 통계학 교수를 퇴직하고 전임 통계 교사로 변신한 벤자민입니다. 통계 분야의 광범위한 경험과 전문 지식을 바탕으로 Statorials를 통해 학생들에게 힘을 실어주기 위해 지식을 공유하고 싶습니다. 더 알아보기