Matplotlib에서 배경색을 변경하는 방법(예제 포함)
Matplotlib에서 플롯의 배경색을 변경하는 가장 쉬운 방법은 set_facecolor() 인수를 사용하는 것입니다.
다음 구문을 사용하여 Matplotlib에서 그림과 축을 정의하는 경우:
fig, ax = plt. subplots ()
그런 다음 다음 구문을 사용하여 플롯의 배경색을 정의할 수 있습니다.
ax. set_facecolor (' pink ')
이 튜토리얼에서는 이 기능의 실제 사용에 대한 몇 가지 예를 제공합니다.
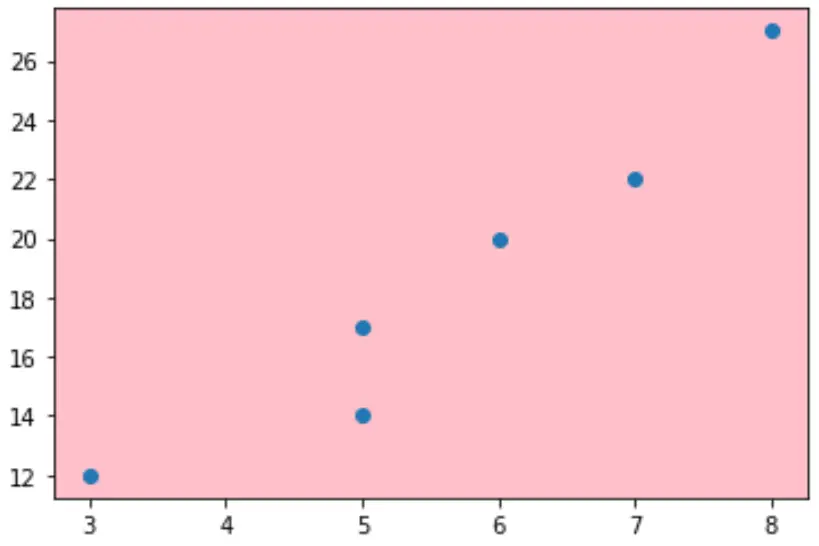
예시 1: 색상 이름을 사용하여 배경색 설정
다음 코드는 색상 이름을 사용하여 Matplotlib 플롯의 배경색을 설정하는 방법을 보여줍니다.
 import matplotlib. pyplot as plt

#define plot figure and axis
fig, ax = plt. subplots ()

#define two arrays for plotting
A = [3, 5, 5, 6, 7, 8]
B = [12, 14, 17, 20, 22, 27]

#create scatterplot and specify background color to be pink
ax. scatter (A, B)
ax. set_facecolor (' pink ')

#display scatterplot
plt. show ()
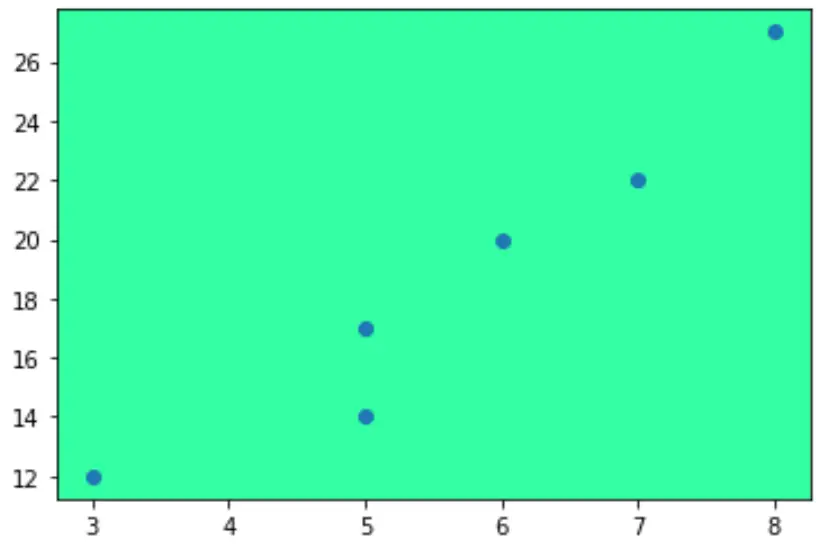
예시 2: 16진수 색상 코드를 사용하여 배경색 설정
다음 코드는 16진수 색상 코드를 사용하여 Matplotlib 플롯의 배경색을 설정하는 방법을 보여줍니다.
 import matplotlib. pyplot as plt

#define plot figure and axis
fig, ax = plt. subplots ()

#define two arrays for plotting
A = [3, 5, 5, 6, 7, 8]
B = [12, 14, 17, 20, 22, 27]

#create scatterplot and specify background color to be pink
ax. scatter (A, B)
ax. set_facecolor (' #33FFA2 ')

#display scatterplot
plt. show ()
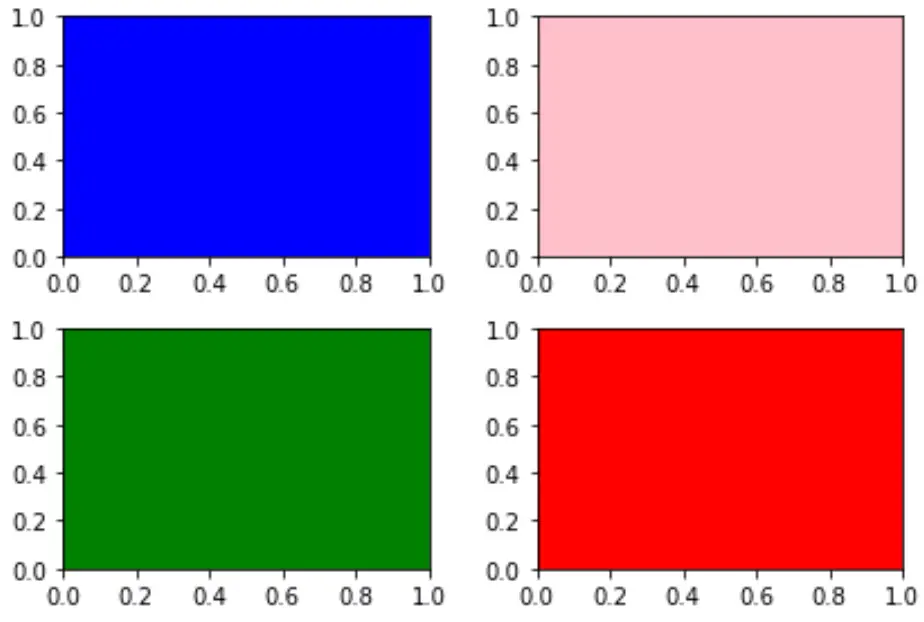
예 3: 특정 서브플롯의 배경색 설정
때로는 여러 Matplotlib 플롯이 있을 수 있습니다. 이 경우 다음 코드를 사용하여 단일 플롯의 배경색을 지정할 수 있습니다.
 import matplotlib. pyplot as plt

#define subplots
fig, ax = plt. subplots (2, 2)
fig. tight_layout ()

#define background color to use for each subplot
ax[0,0]. set_facecolor (' blue ')
ax[0,1]. set_facecolor (' pink ')
ax[1,0]. set_facecolor (' green ')
ax[1,1]. set_facecolor (' red ')

#display subplots
plt. show ()
저자 소개
벤자민 앤더슨
안녕하세요. 저는 통계학 교수를 퇴직하고 전임 통계 교사로 변신한 벤자민입니다. 통계 분야의 광범위한 경험과 전문 지식을 바탕으로 Statorials를 통해 학생들에게 힘을 실어주기 위해 지식을 공유하고 싶습니다. 더 알아보기