Matplotlib에서 수평 그리드만 그리는 방법
다음 기본 구문을 사용하여 Matplotlib에서 수평 그리드만 그릴 수 있습니다.
ax. grid (axis=' y ')
다음 예에서는 실제로 이 구문을 사용하는 방법을 보여줍니다.
예: Matplotlib에서 수평 그리드만 플롯
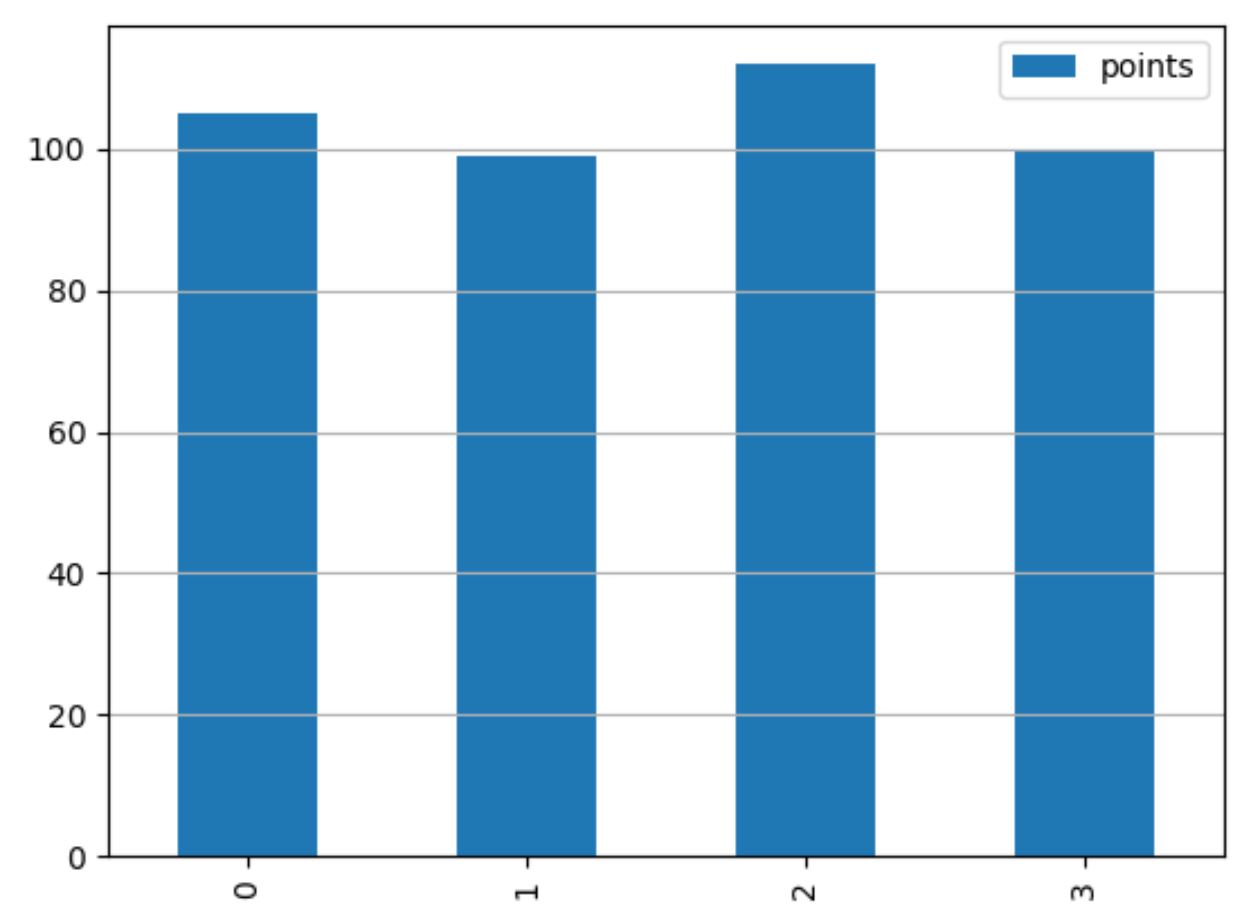
다음 코드는 플롯에 수평 그리드만 표시하여 Matplotlib에서 막대 플롯을 생성하는 방법을 보여줍니다.
 import pandas as pd
import matplotlib. pyplot as plt

#createDataFrame
df = pd. DataFrame ({' team ':['Mavs', 'Nets', 'Spurs', 'Warriors'],
                   ' points ':[105, 99, 112, 100]})

#defineplot
fig, ax = plt. subplots ()

#create bar plot
df. plot (kind=' bar ', ax=ax)

#add horizontal gridlines
ax. grid (axis=' y ')

#displayplot
plt. show ()
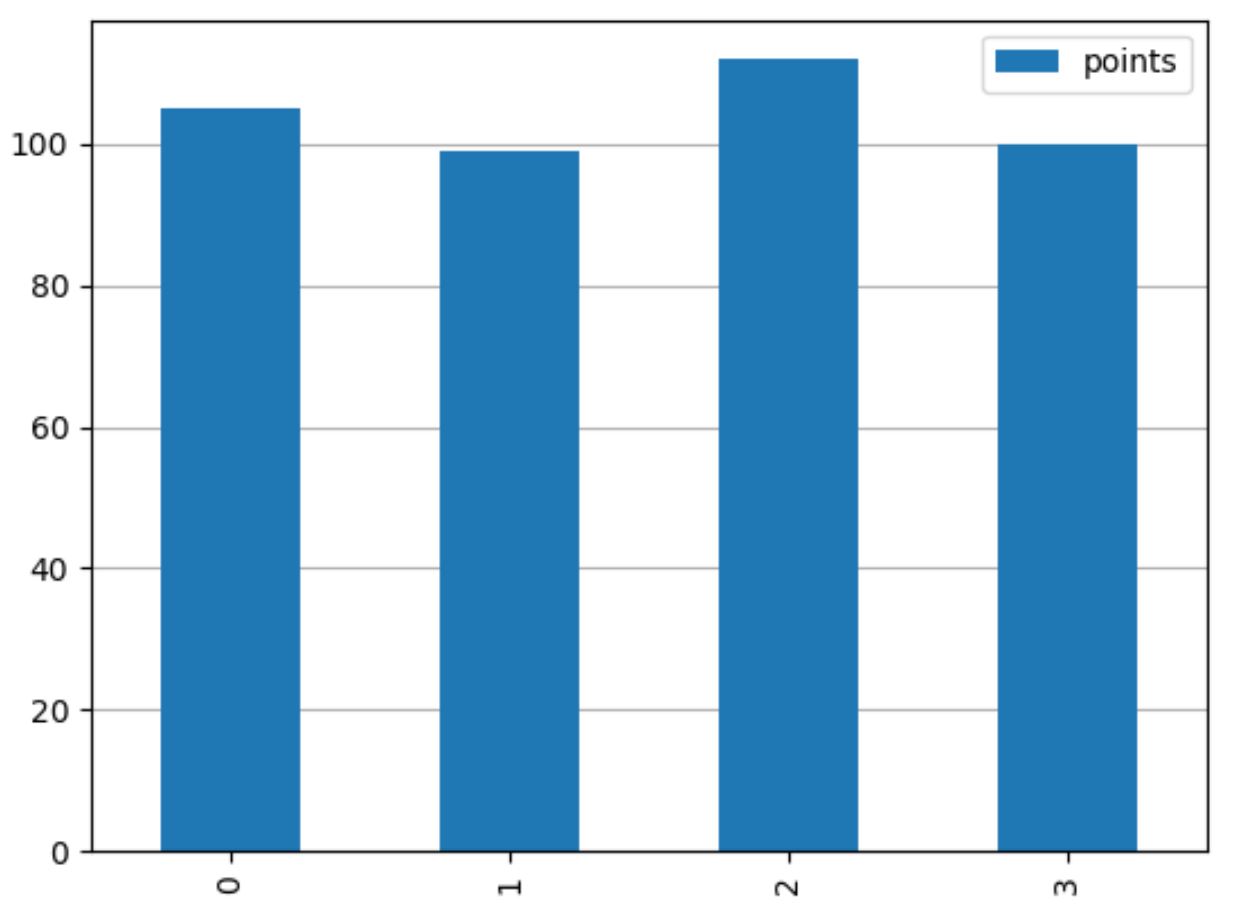
ax.set_axisbelow(True)를 사용하여 플롯의 막대 뒤에 수평 격자선을 표시하십시오.
 import pandas as pd
import matplotlib. pyplot as plt

#createDataFrame
df = pd. DataFrame ({' team ':['Mavs', 'Nets', 'Spurs', 'Warriors'],
                   ' points ':[105, 99, 112, 100]})

#defineplot
fig, ax = plt. subplots ()

#create bar plot
df. plot (kind=' bar ', ax=ax)

#add horizontal gridlines behind bars in the plot
ax. set_axisbelow ( True )
ax. grid (axis=' y ')

#displayplot
plt. show ()
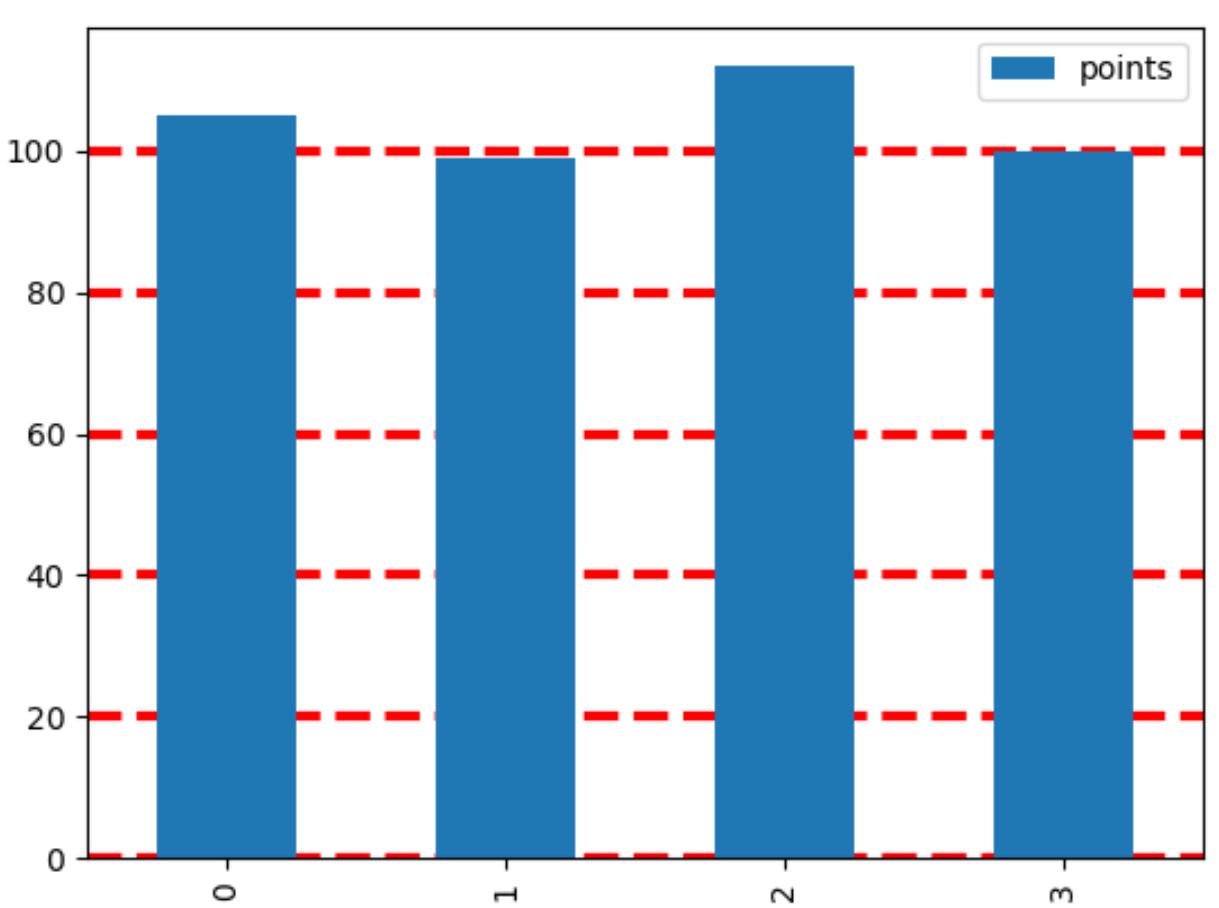
그리고 그리드의 모양을 사용자 정의하려면 Grid() 함수에서 color , linestyle 및 linewidth 인수를 자유롭게 사용하세요.
 import pandas as pd
import matplotlib. pyplot as plt

#createDataFrame
df = pd. DataFrame ({' team ':['Mavs', 'Nets', 'Spurs', 'Warriors'],
                   ' points ':[105, 99, 112, 100]})

#defineplot
fig, ax = plt. subplots ()

#create bar plot
df. plot (kind=' bar ', ax=ax)

#add horizontal gridlines with custom appearance
ax. set_axisbelow ( True )
ax. grid (axis=' y ', color=' red ', linestyle=' dashed ', linewidth= 3 )

#displayplot
plt. show ()
Matplotlib 문서 에서 눈금선을 사용자 정의하는 방법의 전체 목록을 찾을 수 있습니다.
추가 리소스
다음 튜토리얼에서는 Matplotlib에서 다른 일반적인 작업을 수행하는 방법을 설명합니다.
Matplotlib 플롯에서 진드기를 제거하는 방법
Matplotlib 플롯에서 글꼴 크기를 변경하는 방법
Matplotlib에서 플롯에 평균선을 추가하는 방법
저자 소개
벤자민 앤더슨
안녕하세요. 저는 통계학 교수를 퇴직하고 전임 통계 교사로 변신한 벤자민입니다. 통계 분야의 광범위한 경험과 전문 지식을 바탕으로 Statorials를 통해 학생들에게 힘을 실어주기 위해 지식을 공유하고 싶습니다. 더 알아보기