Matplotlib에서 축을 숨기는 방법(예제 포함)
다음 구문을 사용하여 Matplotlib 플롯에서 축을 숨길 수 있습니다.
 import matplotlib. pyplot as plt

#get current axes
ax = plt. gca ()

#hide x-axis
ax. get_xaxis (). set_visible ( False )

#hide y-axis
ax. get_yaxis (). set_visible ( False )
다음 예에서는 이 구문을 실제로 사용하는 방법을 보여줍니다.
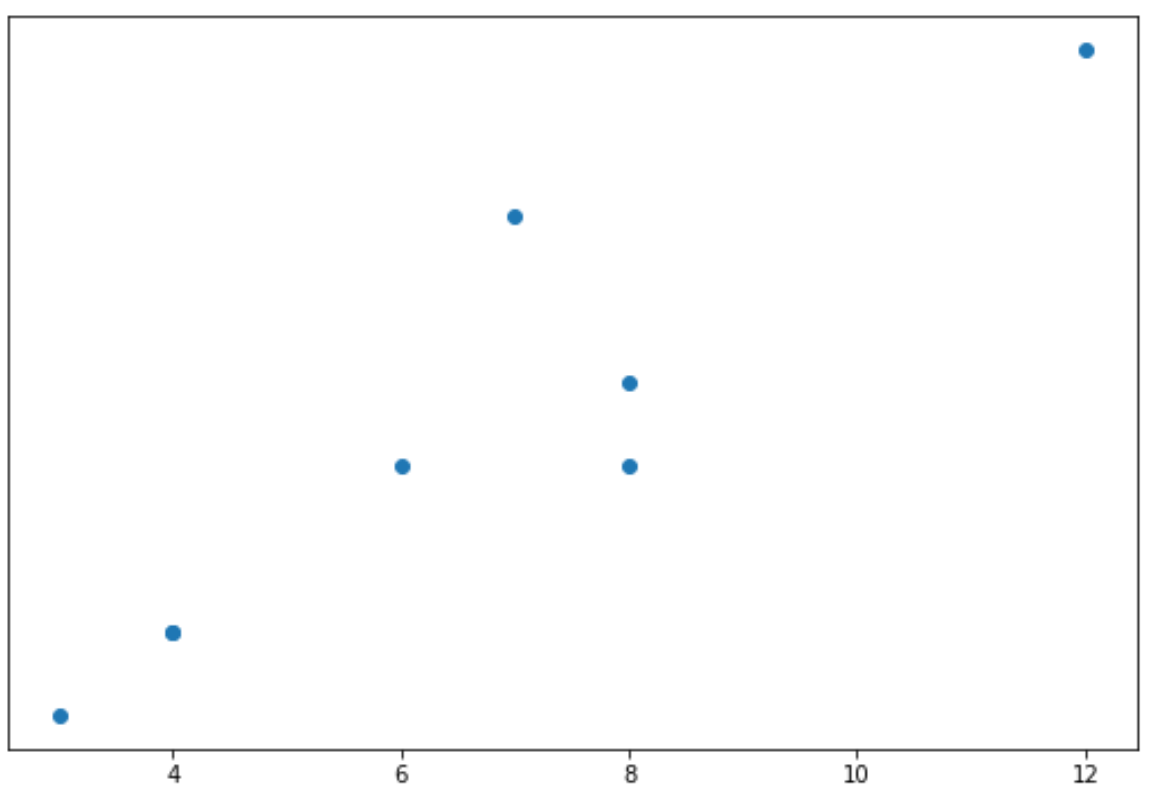
예 1: X축 숨기기
다음 코드는 산점도를 생성하고 x축을 숨기는 방법을 보여줍니다.
 import matplotlib. pyplot as plt

#define data
x = [3, 4, 4, 6, 7, 8, 8, 12]
y = [11, 12, 12, 14, 17, 15, 14, 19]

#create scatterplot
plt. scatter (x,y)

#get current axes
ax = plt. gca ()

#hide x-axis
ax. get_xaxis (). set_visible ( False )
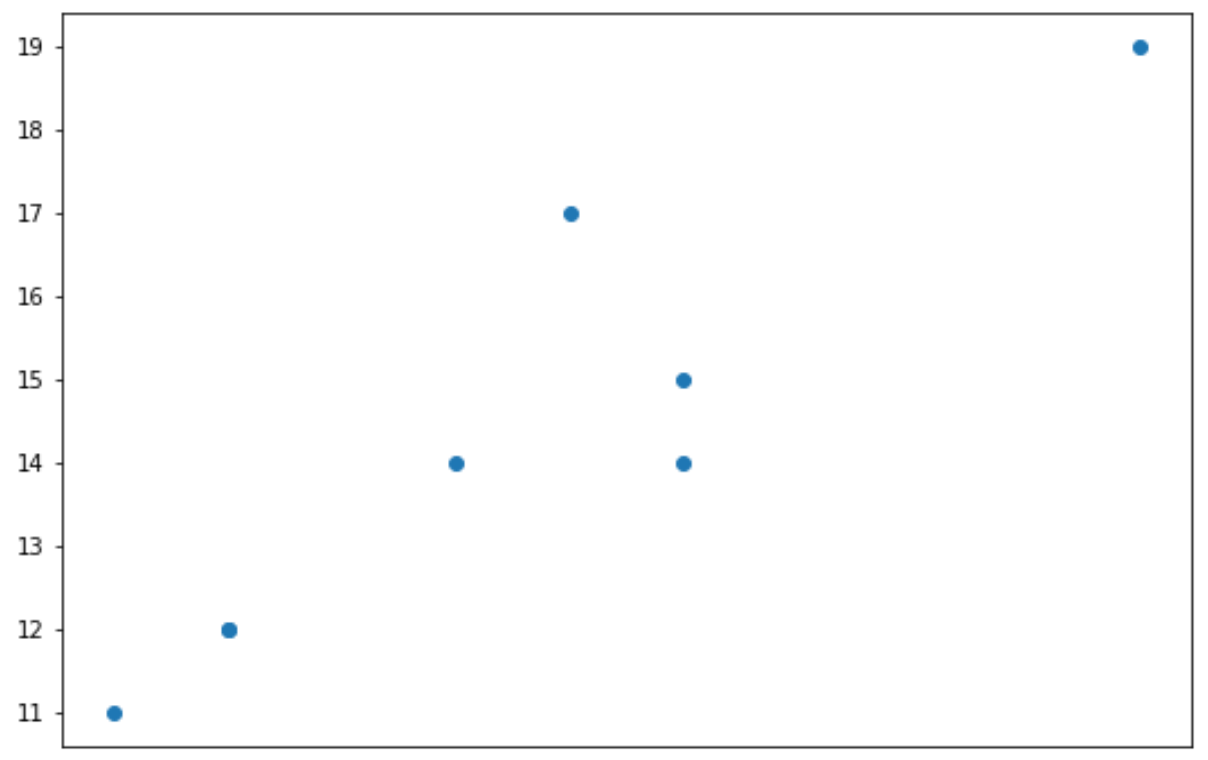
예 2: Y축 숨기기
다음 코드는 산점도를 생성하고 Y축을 숨기는 방법을 보여줍니다.
 import matplotlib. pyplot as plt

#define data
x = [3, 4, 4, 6, 7, 8, 8, 12]
y = [11, 12, 12, 14, 17, 15, 14, 19]

#create scatterplot
plt. scatter (x,y)

#get current axes
ax = plt. gca ()

#hide y-axis
ax. get_yaxis (). set_visible ( False )
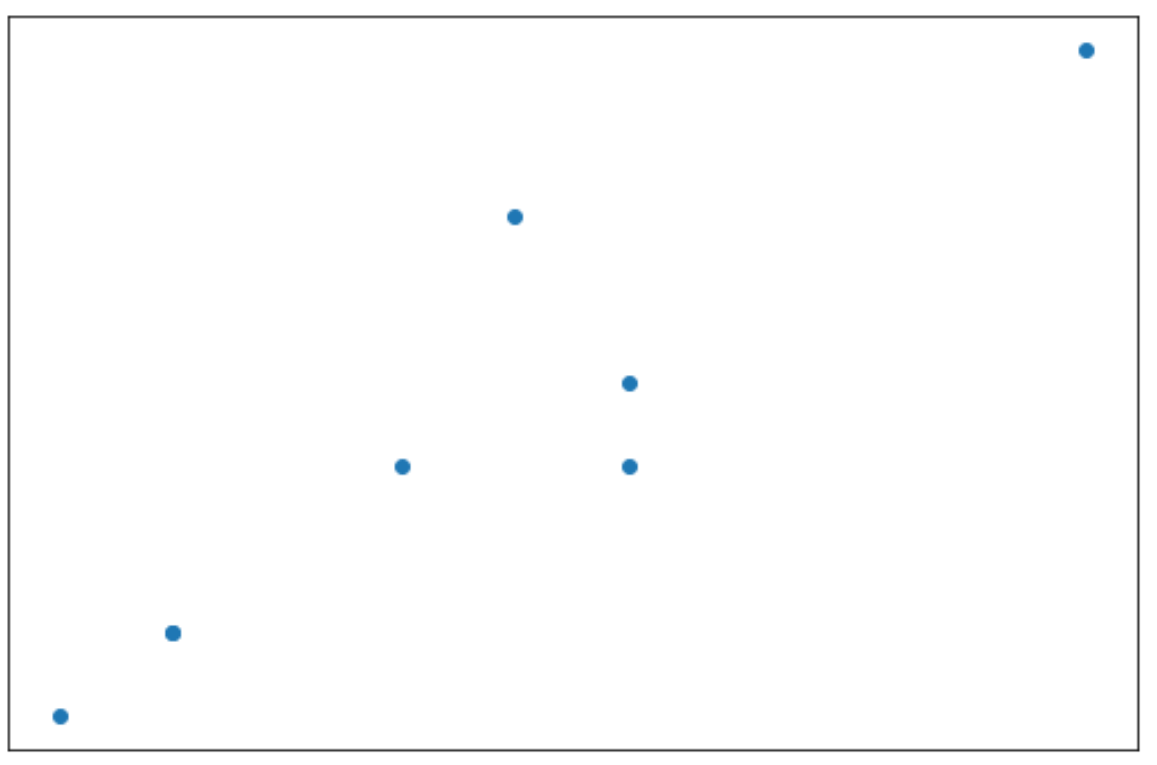
예 3: 두 축 모두 숨기기
다음 코드는 산점도와 숨기기 축을 모두 만드는 방법을 보여줍니다.
 import matplotlib. pyplot as plt

#define data
x = [3, 4, 4, 6, 7, 8, 8, 12]
y = [11, 12, 12, 14, 17, 15, 14, 19]

#create scatterplot
plt. scatter (x,y)

#get current axes
ax = plt. gca ()

#hide x-axis
ax. get_xaxis (). set_visible ( False )

#hide y-axis
ax. get_yaxis (). set_visible ( False )
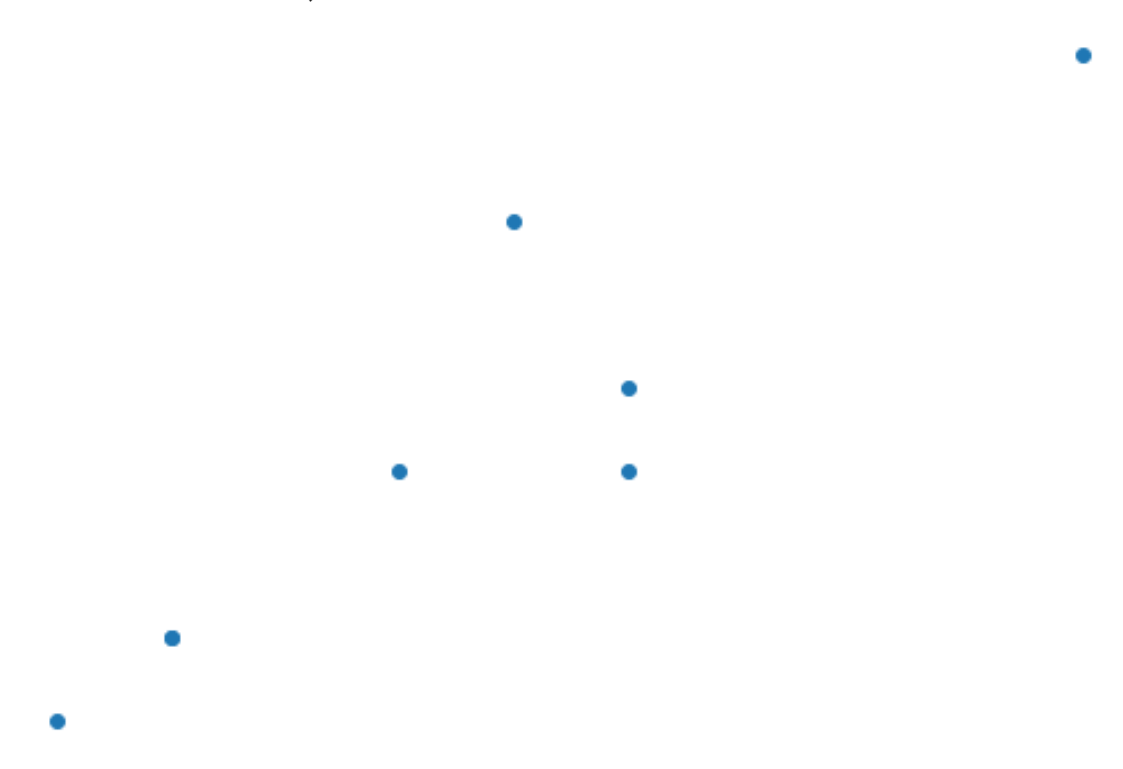
예시 4: 축과 테두리를 완전히 제거
다음 코드는 플롯에서 축과 테두리를 완전히 제거하는 방법을 보여줍니다.
 import matplotlib. pyplot as plt

#define data
x = [3, 4, 4, 6, 7, 8, 8, 12]
y = [11, 12, 12, 14, 17, 15, 14, 19]

#create scatterplot
plt. scatter (x,y)

#get current axes
ax = plt. gca ()

#hide axes and borders
plt. axis (' off ')
추가 리소스
Matplotlib에서 틱 수를 변경하는 방법
Matplotlib에서 체크 표시 라벨을 회전하는 방법
Matplotlib에서 축 범위를 설정하는 방법
저자 소개
벤자민 앤더슨
안녕하세요. 저는 통계학 교수를 퇴직하고 전임 통계 교사로 변신한 벤자민입니다. 통계 분야의 광범위한 경험과 전문 지식을 바탕으로 Statorials를 통해 학생들에게 힘을 실어주기 위해 지식을 공유하고 싶습니다. 더 알아보기