Matplotlib 플롯에 텍스트를 추가하는 방법(예제 포함)
다음 구문을 사용하는 matplotlib.pyplot.text() 함수를 사용하면 Matplotlib 플롯에 텍스트를 쉽게 추가할 수 있습니다.
matplotlib.pyplot.text(x, y, s,fontdict=없음)
금:
- x: 텍스트의 x 좌표
- y: 텍스트의 y 좌표
- s: 텍스트 문자열
- Fontdict: 기본 텍스트 속성을 재정의하는 사전
이 튜토리얼에서는 이 기능의 실제 사용에 대한 몇 가지 예를 보여줍니다.
예 1: Matplotlib 플롯에 고유한 텍스트 추가
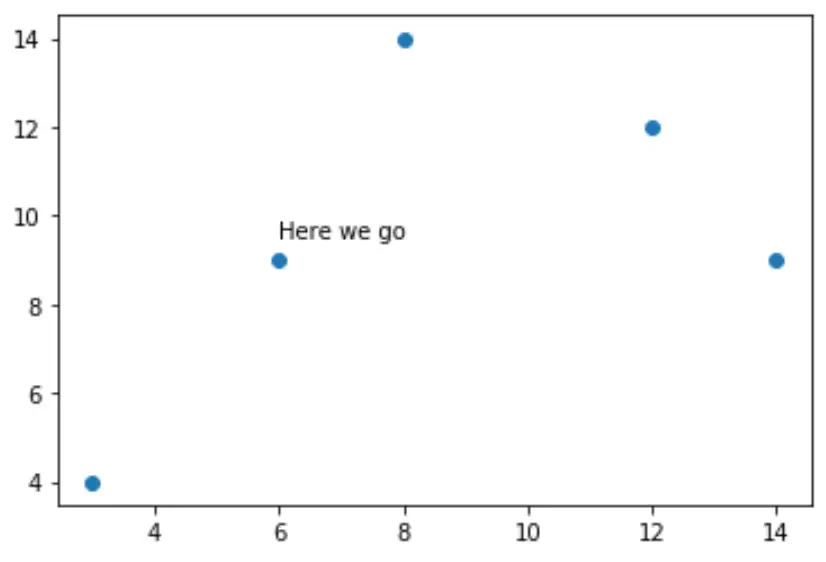
다음 코드는 산점도를 생성하고 플롯에 단일 텍스트를 추가하는 방법을 보여줍니다.
 import matplotlib. pyplot as plt

#createdata
x = [3, 6, 8, 12, 14]
y = [4, 9, 14, 12, 9]

#create scatterplot
plt. scatter (x,y)

#add text at (x, y) coordinates = (6, 9.5)
plt. text (6, 9.5, ' Here we go ')

예 2: Matplotlib 플롯에 여러 텍스트 추가
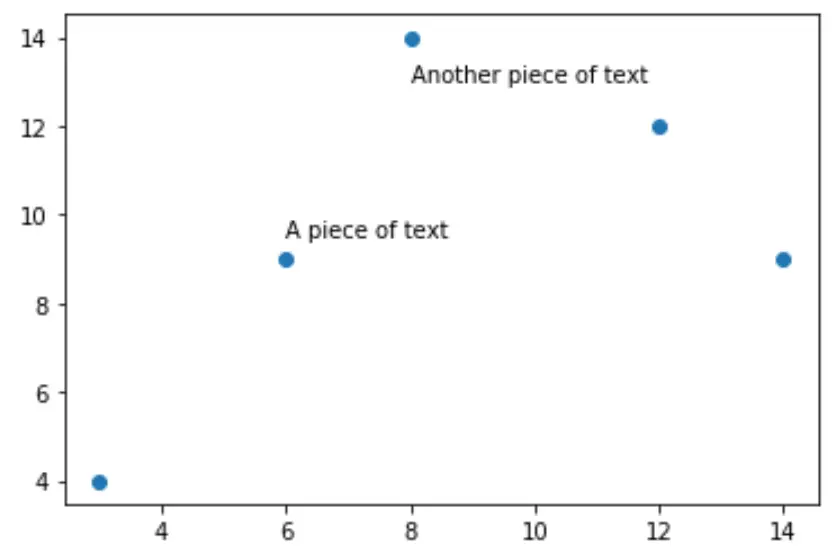
다음 코드는 산점도를 생성하고 플롯에 여러 텍스트를 추가하는 방법을 보여줍니다.
 import matplotlib. pyplot as plt

#create data
x = [3, 6, 8, 12, 14]
y = [4, 9, 14, 12, 9]

#create scatterplot
plt. scatter (x,y)

#add text at (x, y) coordinates = (6, 9.5)
plt. text (6, 9.5, ' A piece of text ')

#add another piece of text
plt. text (8, 13, ' Another piece of text ')

예 3: 텍스트 속성 편집
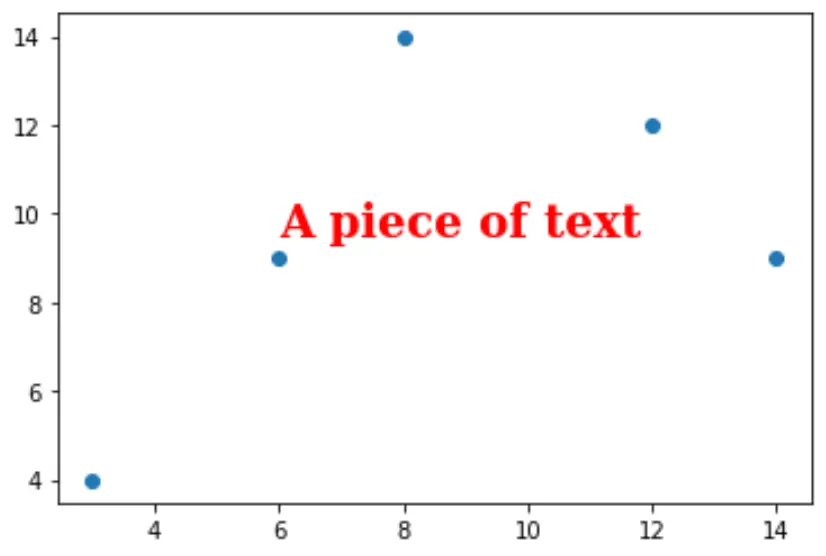
텍스트 속성을 변경하려면 글꼴 속성을 지정하는 사전을 생성하면 됩니다.
다음 코드는 이를 수행하는 방법을 보여줍니다.
 import matplotlib. pyplot as plt

#createdata
x = [3, 6, 8, 12, 14]
y = [4, 9, 14, 12, 9]

#create scatterplot
plt. scatter (x,y)

font = {' family ': ' serif ',
        ' color ': ' red ',
        ' weight ': ' bold ',
        ' size ': 20
        }

#add text with custom font
plt. text (6, 9.5, ' A piece of text ', fontdict=font)

예 4: 텍스트 주위에 프레임 추가
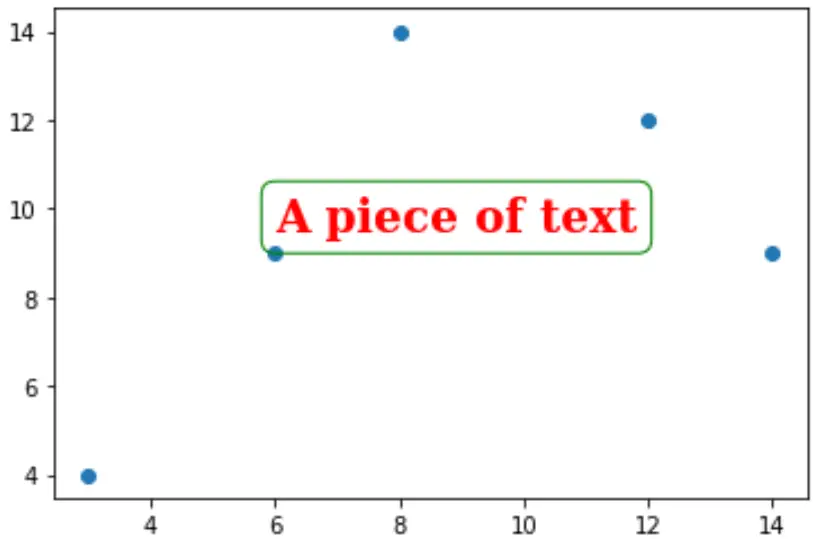
다음 코드는 텍스트 주위에 프레임을 추가하는 방법을 보여줍니다.
 import matplotlib. pyplot as plt

#createdata
x = [3, 6, 8, 12, 14]
y = [4, 9, 14, 12, 9]

#create scatterplot
plt. scatter (x,y)

font = {' family ': ' serif ',
        ' color ': ' red ',
        ' weight ': ' bold ',
        ' size ': 20
        }

box = {' facecolor ': ' none ',
       ' edgecolor ': ' green ',
       ' boxstyle ': ' round '
      }

#add text with custom font
plt. text (6, 9.5, ' A piece of text ', fontdict=font, bbox=box)
