Matplotlib에서 화살표를 그리는 방법
Matplotlib에서 화살표를 그리려면 다음 구문을 사용하는 matplotlib.pyplot.arrow 함수를 사용할 수 있습니다 .
matplotlib.pyplot.arrow(x, y, dx, dy)
금:
- x, y: 화살표 밑면의 x 및 y 좌표
- dx, dy: x, y 방향의 화살표 길이
이 튜토리얼에서는 이 기능의 실제 사용에 대한 몇 가지 예를 제공합니다.
예 1: 단일 화살표 그리기
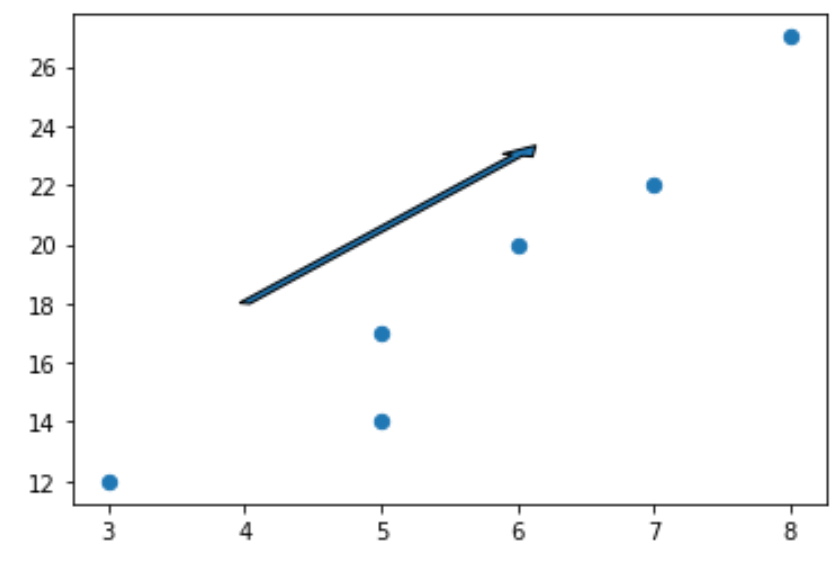
다음 코드는 Matplotlib 플롯에 단일 화살표를 그리는 방법을 보여줍니다.
 import matplotlib. pyplot as plt

#define two arrays for plotting
A = [3, 5, 5, 6, 7, 8]
B = [12, 14, 17, 20, 22, 27]

#create scatterplot, specifying marker size to be 40
plt. scatter (A, B, s= 40 )

#add arrow to plot
plt. arrow (x= 4 , y= 18 , dx= 2 , dy= 5 , width= .08 )

#displayplot
plt. show ()
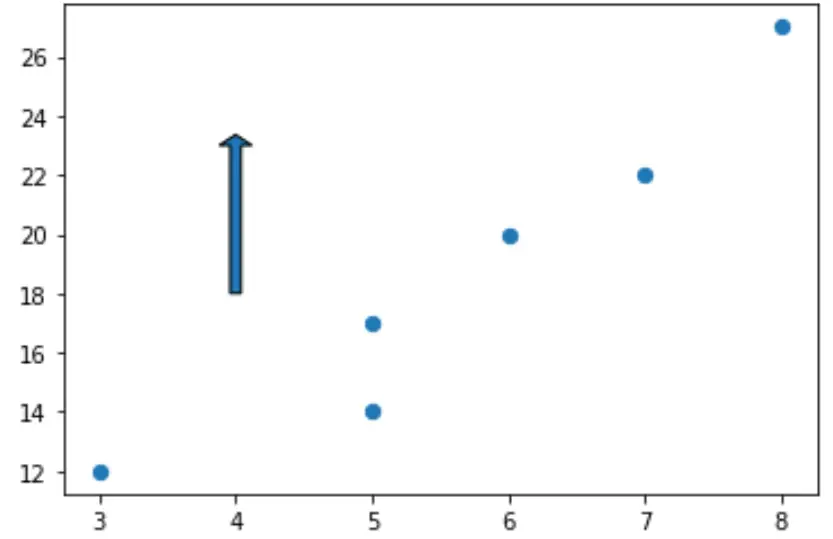
수직 화살표를 생성하려면 dx=0을 설정하고 수평 화살표를 생성하려면 dy=0을 설정할 수 있습니다.
예를 들어 수직 화살표를 만드는 방법은 다음과 같습니다.
 import matplotlib. pyplot as plt

#define two arrays for plotting
A = [3, 5, 5, 6, 7, 8]
B = [12, 14, 17, 20, 22, 27]

#create scatterplot, specifying marker size to be 40
plt. scatter (A, B, s= 40 )

#add arrow to plot
plt. arrow (x= 4 , y= 18 , dx= 0 , dy= 5 , width= .08 )

#displayplot
plt. show ()
예 2: 화살표 스타일 지정
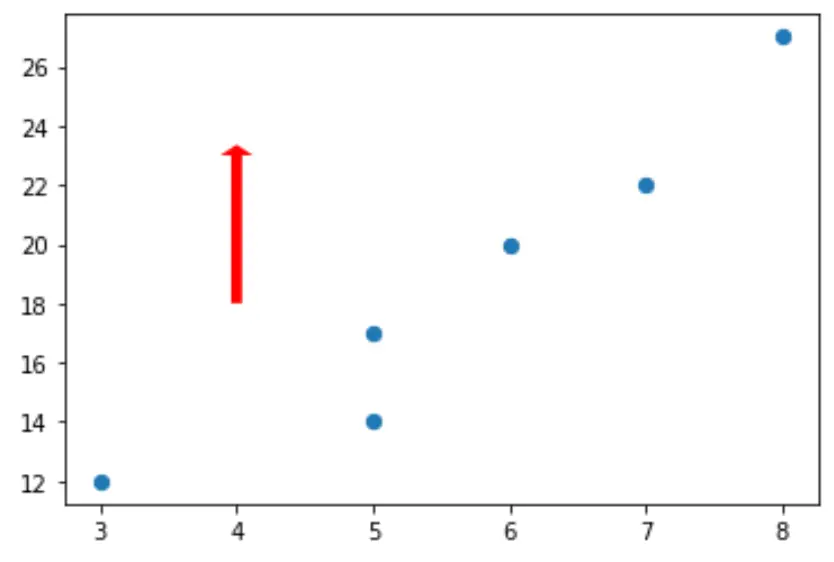
기본적으로 Matplotlib의 화살표는 파란색이고 가장자리는 검은색이지만, facecolor 및 edgecolor 인수를 사용하여 이를 쉽게 변경할 수 있습니다.
 import matplotlib. pyplot as plt

#define two arrays for plotting
A = [3, 5, 5, 6, 7, 8]
B = [12, 14, 17, 20, 22, 27]

#create scatterplot, specifying marker size to be 40
plt. scatter (A, B, s= 40 )

#add arrow to plot
plt. arrow (x= 4 , y= 18 , dx= 0 , dy= 5 , width= .08 , facecolor= 'red' , edgecolor= 'none' )

#displayplot
plt. show ()
여기에서 화살표에 적용할 수 있는 스타일 속성의 전체 목록을 찾을 수 있습니다.
예 3: 화살표에 주석 추가
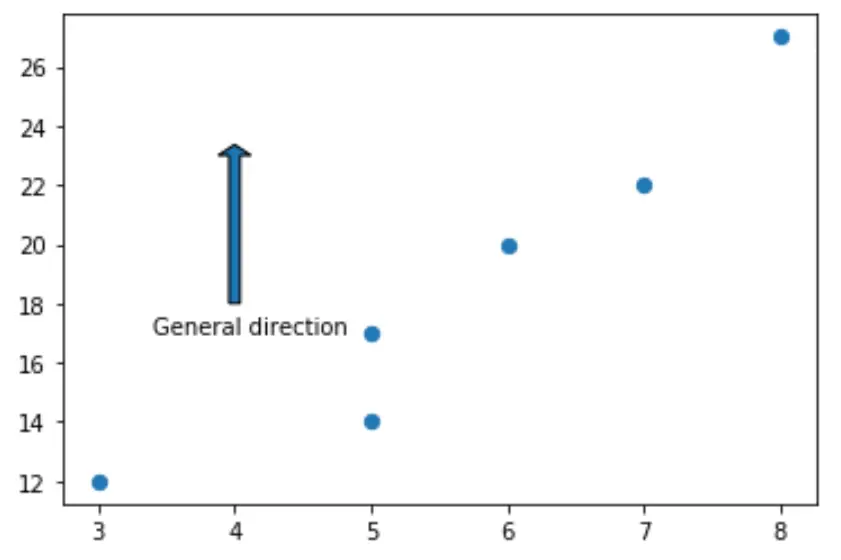
다음 코드는 Matplotlib 플롯의 화살표 아래에 주석을 추가하는 방법을 보여줍니다.
 import matplotlib. pyplot as plt

#define two arrays for plotting
A = [3, 5, 5, 6, 7, 8]
B = [12, 14, 17, 20, 22, 27]

#create scatterplot, specifying marker size to be 40
plt. scatter (A, B, s= 40 )

#add arrow to plot
plt. arrow (x= 4 , y= 18 , dx= 0 , dy= 5 , width= .08 )

#add annotation
plt. annotate (' General direction ', xy = (3.4, 17))

#displayplot
plt. show ()
추가 리소스
Matplotlib에서 원을 그리는 방법(예제 포함)
Matplotlib에서 직사각형을 그리는 방법(예제 포함)
저자 소개
벤자민 앤더슨
안녕하세요. 저는 통계학 교수를 퇴직하고 전임 통계 교사로 변신한 벤자민입니다. 통계 분야의 광범위한 경험과 전문 지식을 바탕으로 Statorials를 통해 학생들에게 힘을 실어주기 위해 지식을 공유하고 싶습니다. 더 알아보기