Seaborn regplot에서 회귀 방정식을 표시하는 방법
seaborn regplot 함수를 사용하여 데이터 세트에 맞는 선형 회귀 모델을 그릴 수 있습니다.
불행하게도 Seaborn에는 선에서 회귀 방정식을 추출하는 내장 기능이 없지만 scipy.stats.linregress 함수를 사용하여 회귀 계수를 빠르게 찾을 수 있습니다.
 import scipy
import seaborn as sns

#create regplot
p = sns. regplot (data=df, x=df. x , y=df. y )

#calculate slope and intercept of regression equation
slope, intercept, r, p, sterr = scipy. stats . linregress (x= p.get_lines ()[0] .get_xdata (),
                                                       y=p. get_lines ()[0]. get_ydata ())
다음 예에서는 실제로 이 구문을 사용하는 방법을 보여줍니다.
예: Seaborn Regplot에 회귀 방정식 표시
다양한 학생의 공부 시간과 최종 시험 점수에 대한 정보가 포함된 다음과 같은 pandas DataFrame이 있다고 가정합니다.
 import pandas as pd

#createDataFrame
df = pd. DataFrame ({' hours ': [1, 2, 3, 4, 5, 6, 7, 8, 9, 10],
                   ' score ': [77, 79, 84, 80, 81, 89, 95, 90, 83, 89]})

#view DataFrame
print (df)

   hours score
0 1 77
1 2 79
2 3 84
3 4 80
4 5 81
5 6 89
6 7 95
7 8 90
8 9 83
9 10 89
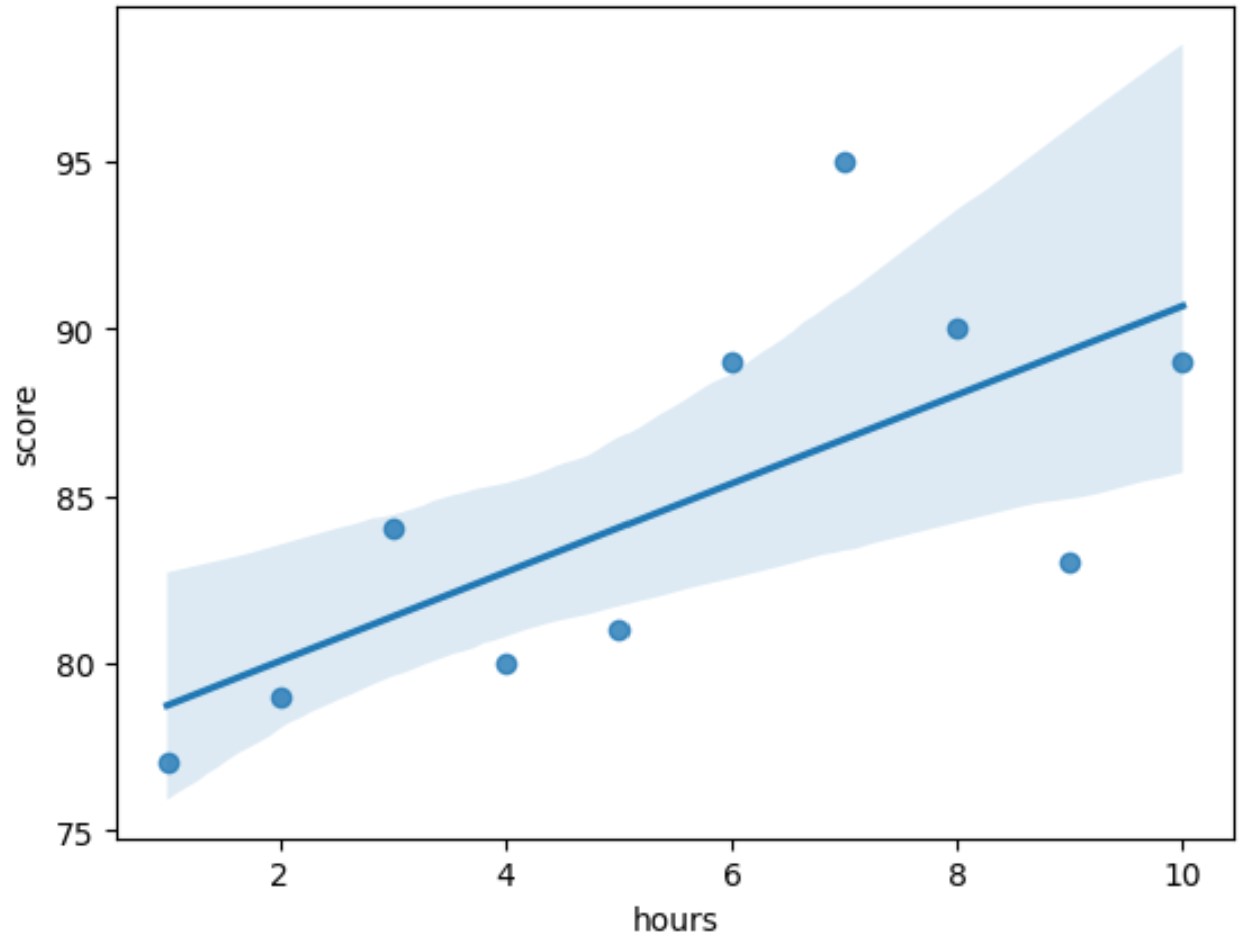
데이터 포인트를 표시하고 데이터에 적합 회귀선을 추가한다고 가정해 보겠습니다.
이를 위해 다음 구문을 사용할 수 있습니다.
 import scipy
import seaborn as sns

#create regplot
p = sns. regplot (data=df, x=df. hours , y=df. score )

#calculate slope and intercept of regression equation
slope, intercept, r, p, sterr = scipy. stats . linregress (x= p.get_lines ()[0] .get_xdata (),
                                                       y=p. get_lines ()[0]. get_ydata ())

#display slope and intercept of regression equation
print (intercept, slope)

77.39999999999995 1.3272727272727356
결과에서 회귀선에 다음 방정식이 있음을 알 수 있습니다.
y = 77.4 + 1.327
이 방정식을 seaborn regplot 에 표시하려면 matplotlib text() 함수를 사용할 수 있습니다.
 import matplotlib. pyplot as plt
import scipy
import seaborn as sns

#create regplot
p = sns. regplot (data=df, x=df. hours , y=df. score )

#calculate slope and intercept of regression equation
slope, intercept, r, p, sterr = scipy. stats . linregress (x= p.get_lines ()[0] .get_xdata (),
                                                       y=p. get_lines ()[0]. get_ydata ())

#add regression equation to plot
plt. text (2, 95, ' y = ' + str(round(intercept,3)) + ' + ' + str(round(slope,3)) + ' x ')
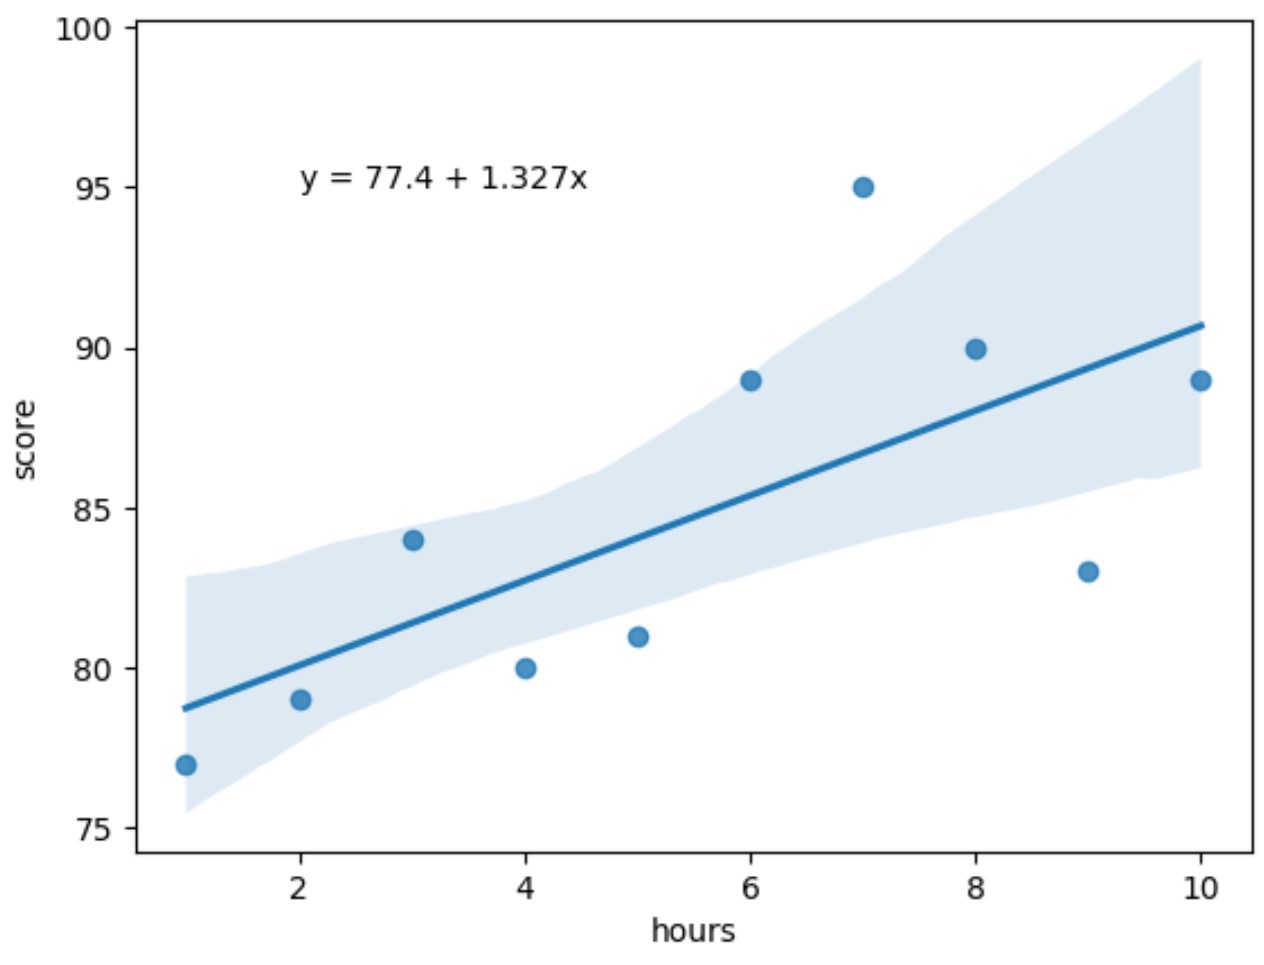
이제 회귀 방정식이 플롯의 왼쪽 상단에 표시됩니다.
text() 함수에서 회귀 방정식이 (2, 95)의 (x, y) 좌표에서 표시되어야 함을 지정했습니다.
자신의 플롯에서 원하는 위치에 회귀 방정식을 표시하려면 이러한 좌표를 자유롭게 수정하십시오.
참고 : 여기에서 seaborn regplot 기능에 대한 전체 문서를 찾을 수 있습니다.
추가 리소스
다음 튜토리얼에서는 Seaborn에서 다른 일반적인 작업을 수행하는 방법을 설명합니다.
Seaborn 플롯의 그림 크기를 조정하는 방법
Seaborn에서 범례의 위치를 변경하는 방법
Seaborn 플롯에서 축 레이블을 변경하는 방법
저자 소개
벤자민 앤더슨
안녕하세요. 저는 통계학 교수를 퇴직하고 전임 통계 교사로 변신한 벤자민입니다. 통계 분야의 광범위한 경험과 전문 지식을 바탕으로 Statorials를 통해 학생들에게 힘을 실어주기 위해 지식을 공유하고 싶습니다. 더 알아보기