Ggplot2에서 병렬 플롯을 만드는 방법
종종 R의 ggplot2 패키지를 사용하여 두 개의 플롯을 나란히 만들고 싶을 수도 있습니다. 다행히 패치워크 패키지의 도움으로 이 작업을 쉽게 수행할 수 있습니다.
 #install ggplot2 and patchwork packages
install.packages(' ggplot2 ')
install.packages(' patchwork ')

#load the packages
library(ggplot2)
library(patchwork)
이 튜토리얼에서는 이러한 패키지를 사용하여 병렬 플롯을 만드는 몇 가지 예를 보여줍니다.
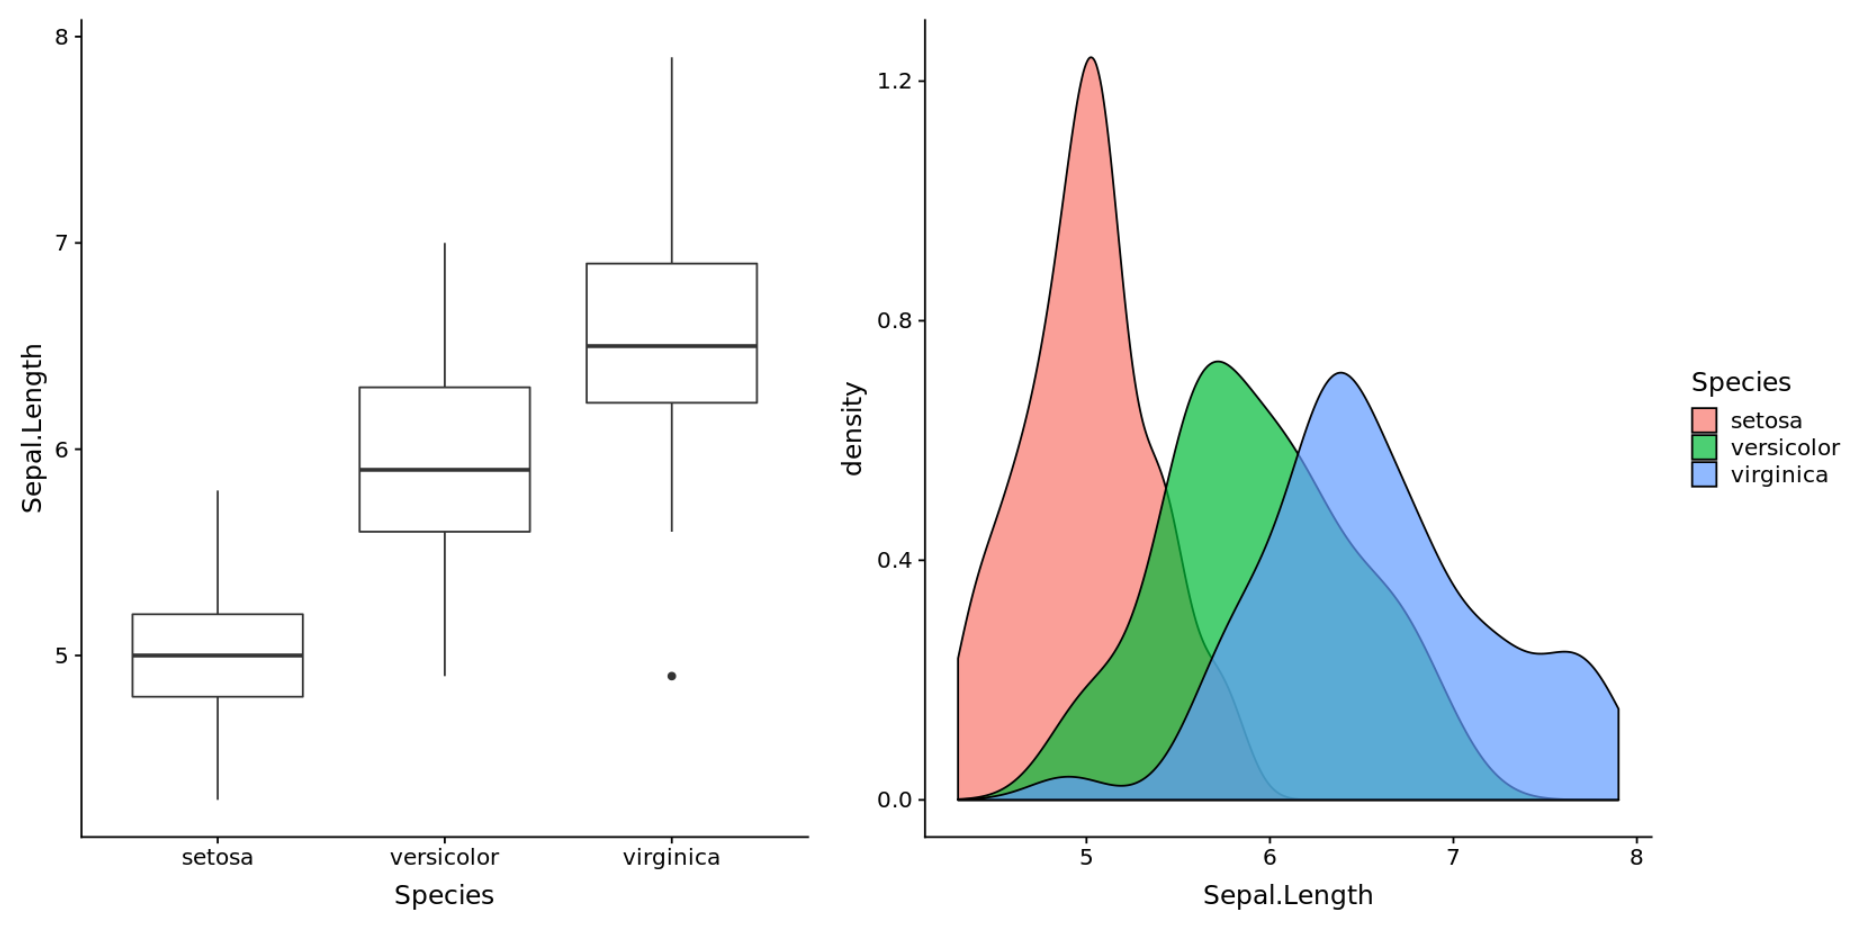
예 1: 나란히 있는 두 개의 플롯
다음 코드는 R에 내장된 붓꽃 데이터 세트를 사용하여 두 개의 병렬 플롯을 만드는 방법을 보여줍니다.
 #create box plot
plot1 <- ggplot(iris, aes(x = Species, y = Sepal.Length)) +
  geom_boxplot()

#create density plot
plot2 <- ggplot(iris, aes(x = Sepal.Length, fill = Species)) +
  geom_density(alpha = 0.8)

#display plots side by side
plot1 + plot2
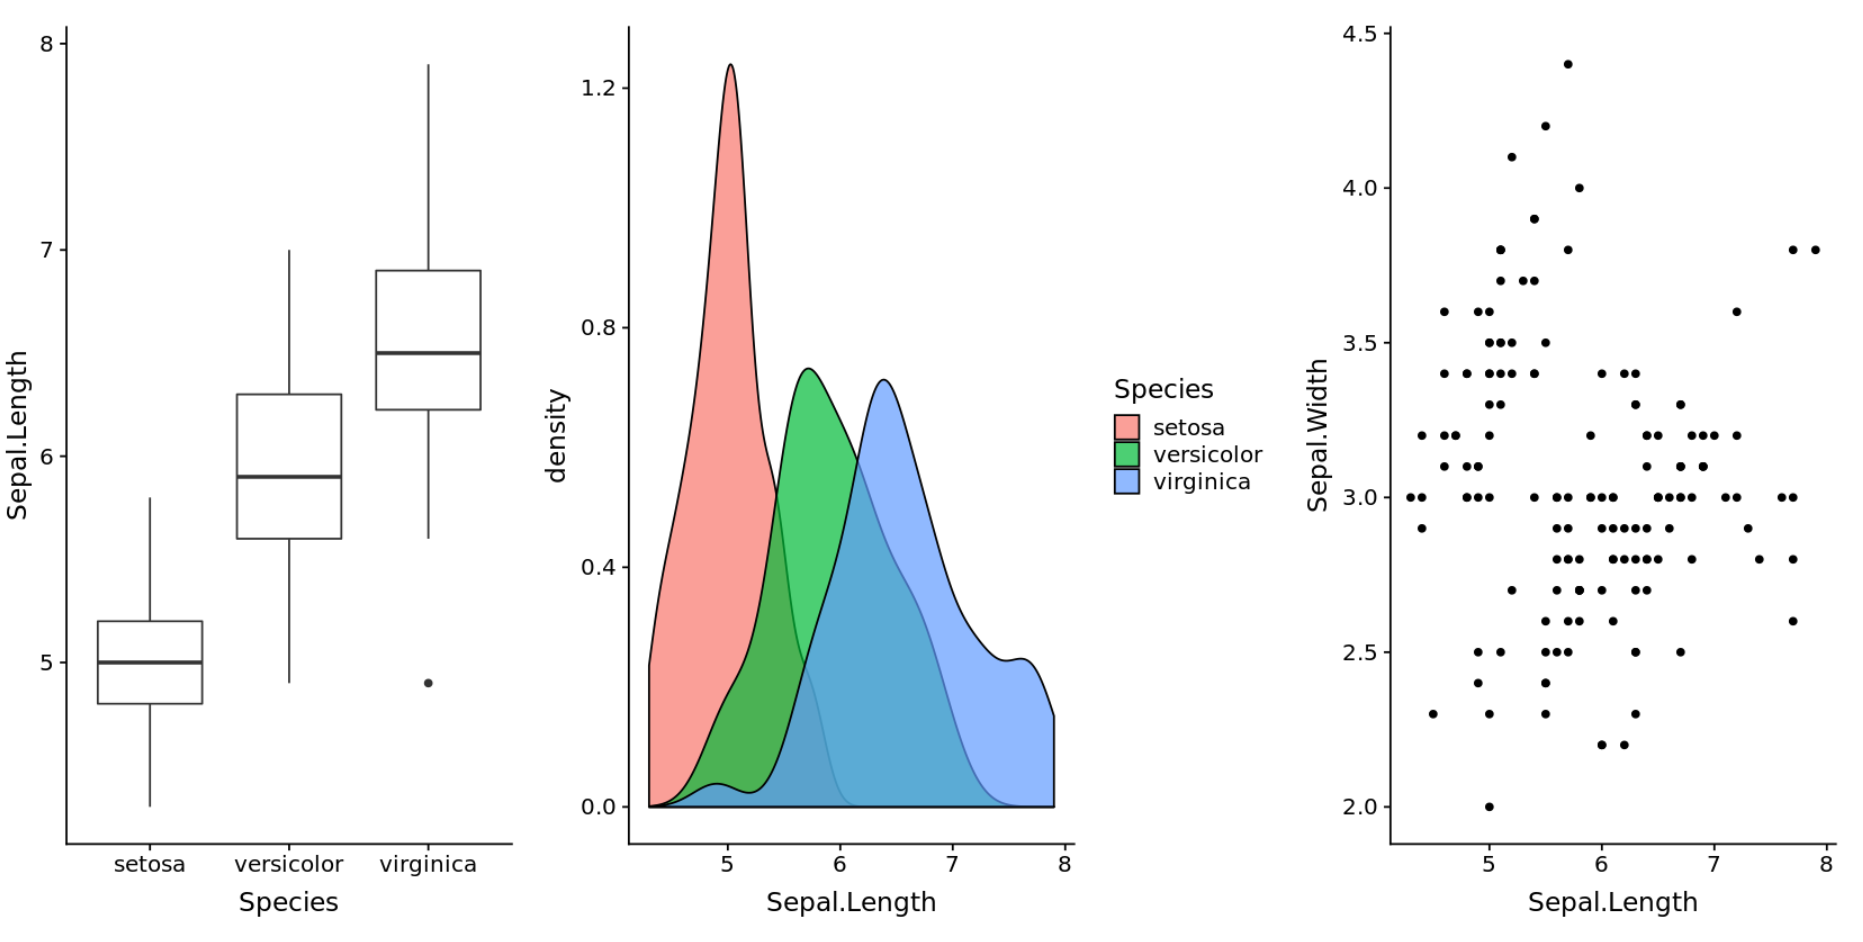
예 2: 나란히 있는 세 개의 플롯
다음 코드는 R에 내장된 붓꽃 데이터세트를 사용하여 세 개의 병렬 플롯을 만드는 방법을 보여줍니다.
 #create box plot
plot1 <- ggplot(iris, aes(x = Species, y = Sepal.Length)) +
  geom_boxplot()

#create density plot
plot2 <- ggplot(iris, aes(x = Sepal.Length, fill = Species)) +
  geom_density(alpha = 0.7)

#create scatterplot
plot3 <- ggplot(iris, aes(x = Sepal.Length, y = Sepal.Width)) +
  geom_point()

#display three plots side by side
plot1 + plot2 + plot3
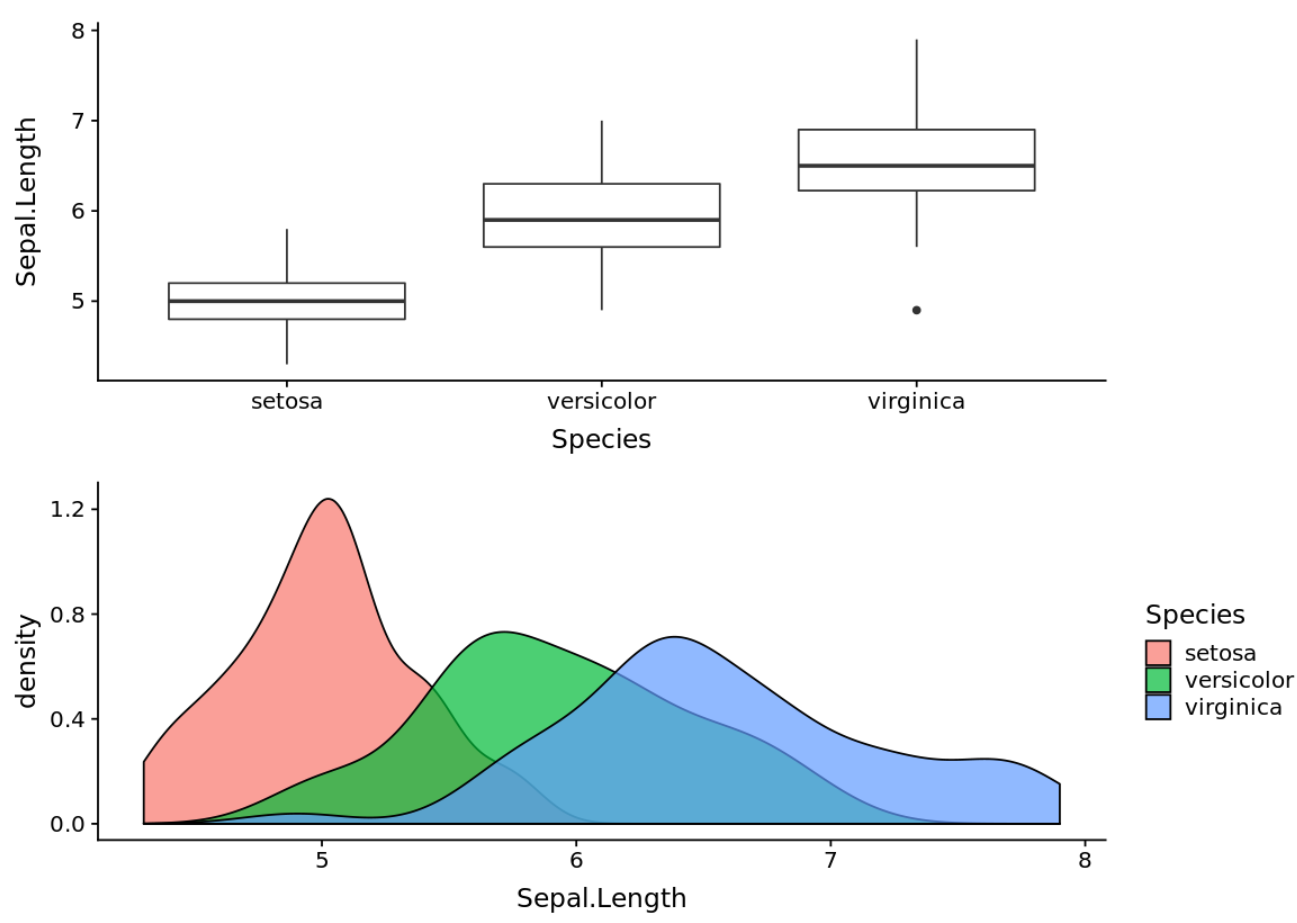
예시 3: 두 개의 누적 플롯
다음 코드는 두 개의 누적 플롯을 만드는 방법을 보여줍니다.
 #create box plot
plot1 <- ggplot(iris, aes(x = Species, y = Sepal.Length)) +
  geom_boxplot()

#create density plot
plot2 <- ggplot(iris, aes(x = Sepal.Length, fill = Species)) +
  geom_density(alpha = 0.7)

#display plots stacked on top of each other
plot1 / plot2
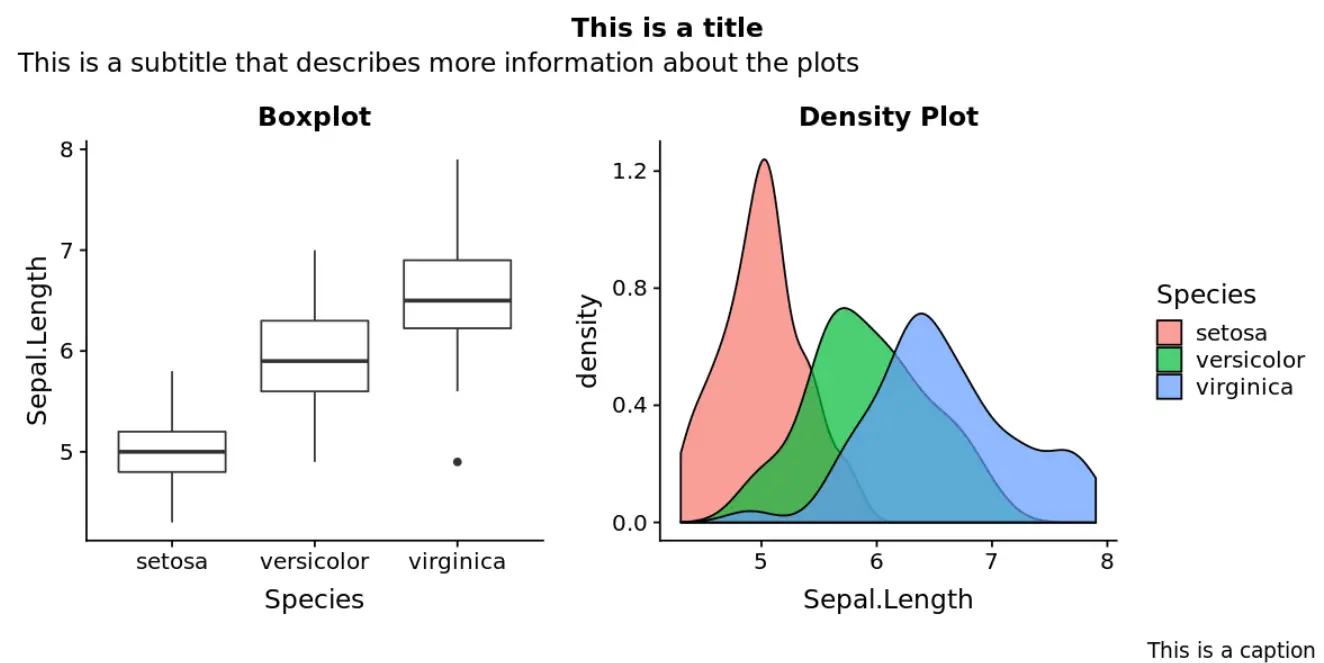
예 4: 제목, 부제, 캡션 추가
다음 코드는 플롯에 제목, 부제, 캡션을 추가하는 방법을 보여줍니다.
 #create box plot
plot1 <- ggplot(iris, aes(x = Species, y = Sepal.Length)) +
  geom_boxplot() +
  ggtitle('Boxplot')

#create density plot
plot2 <- ggplot(iris, aes(x = Sepal.Length, fill = Species)) +
  geom_density(alpha = 0.7) +
  ggtitle('Density Plot')

#display plots side by side with title, subtitle, and captions
patchwork <- plot1 + plot2

patchwork + plot_annotation(
  title = ' This is a title ',
  subtitle = ' This is a subtitle that describes more information about the plots ',
  caption = ' This is a caption '
)
여기에서 더 많은 R 튜토리얼을 찾을 수 있습니다.
저자 소개
벤자민 앤더슨
안녕하세요. 저는 통계학 교수를 퇴직하고 전임 통계 교사로 변신한 벤자민입니다. 통계 분야의 광범위한 경험과 전문 지식을 바탕으로 Statorials를 통해 학생들에게 힘을 실어주기 위해 지식을 공유하고 싶습니다. 더 알아보기