단일 그림에 여러 seaborn 플롯을 생성하는 방법
FacetGrid() 함수를 사용하여 단일 그림에 여러 Seaborn 플롯을 생성할 수 있습니다.
 #definegrid
g = sns. FacetGrid (data=df, col=' variable1 ', col_wrap= 2 )

#add plots to grid
g. map ( sns.scatterplot , ' variable2 ', ' variable3 ')
col 인수는 래핑할 변수를 지정하고 col_wrap 인수는 한 줄에 표시할 플롯 수를 지정합니다.
다음 예에서는 내장된 “팁” 데이터세트를 사용하여 실제로 이 기능을 사용하는 방법을 보여줍니다.
 #load tips dataset
tips = sns. load_dataset (' tips ')

#view first five rows of tips dataset
tips. head ()

   total_bill tip sex smoker day time size
0 16.99 1.01 Female No Sun Dinner 2
1 10.34 1.66 Male No Sun Dinner 3
2 21.01 3.50 Male No Sun Dinner 3
3 23.68 3.31 Male No Sun Dinner 2
4 24.59 3.61 Female No Sun Dinner 4
예 1: 여러 경로 만들기
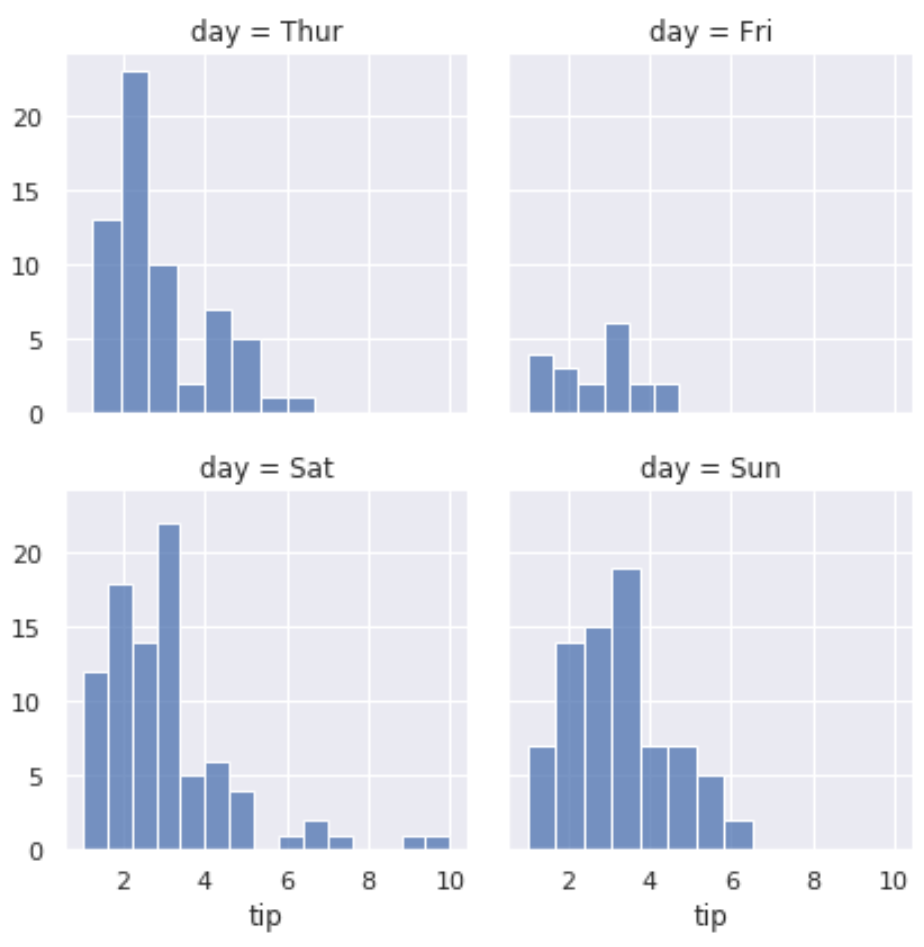
다음 코드는 단일 그림에서 여러 Seaborn 플롯을 생성하는 방법을 보여줍니다.
 #define grid with two plots per row
g = sns. FacetGrid (data=tips, col=' day ', col_wrap= 2 )

#add histograms to each plot
g. map (sns. histplot , ' tip ')

이 간단한 코드로 수행한 작업은 다음과 같습니다.
- 변수 ‘day’를 기준으로 그룹화하도록 지정됨
- 한 줄에 2개의 플롯을 표시하도록 지정됨
- 각 특정 날짜에 대한 “팁” 값의 분포를 보여주는 각 플롯에 히스토그램을 표시하도록 지정됩니다.
예 2: 특정 높이를 가진 여러 경로 만들기
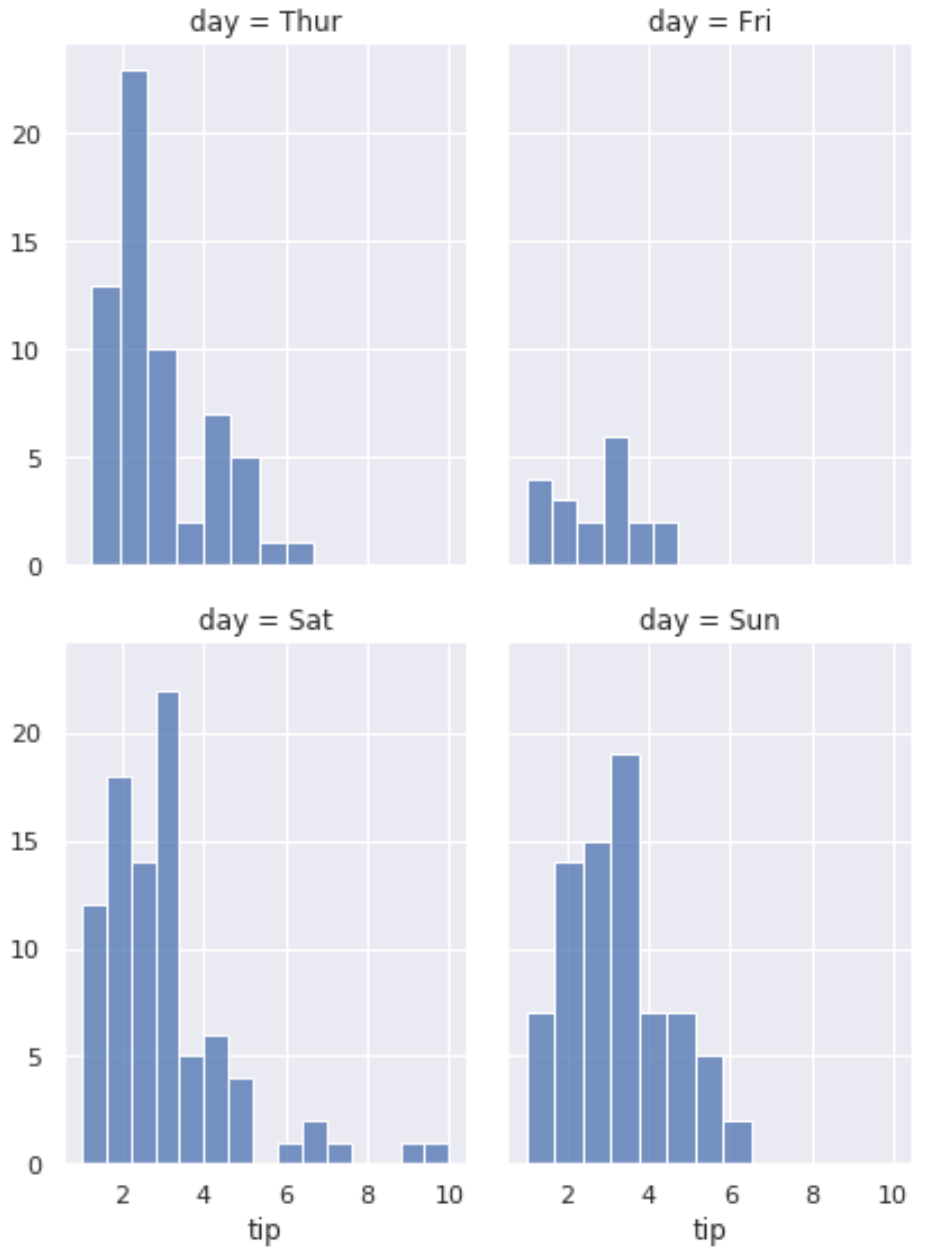
다음 코드는 특정 높이와 종횡비를 가진 여러 Seaborn 플롯을 생성하는 방법을 보여줍니다.
 #definegrid
g = sns. FacetGrid (data=tips, col=' day ', col_wrap= 2 , height= 4 , aspect= .75 )

#add histograms to each plot
g. map (sns. histplot , ' tip ')

예 3: 범례가 포함된 여러 플롯 생성
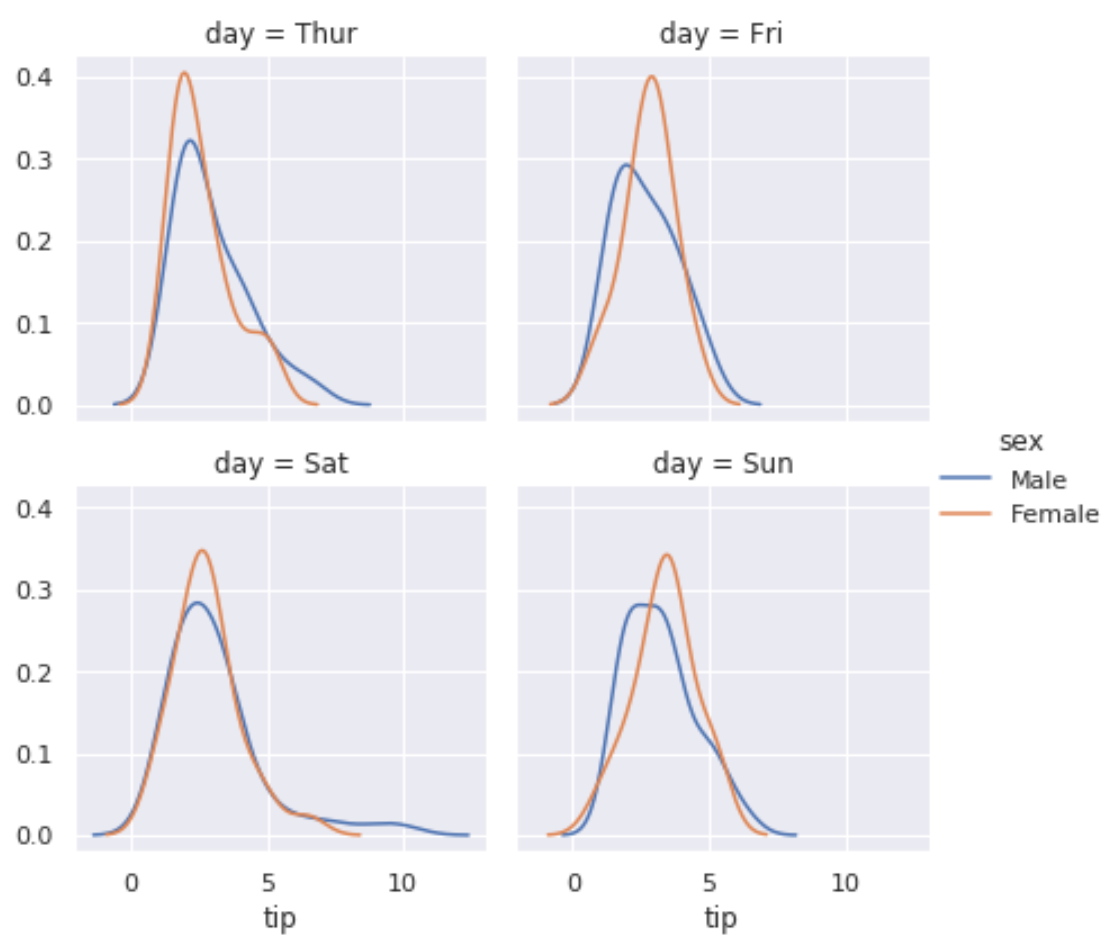
다음 코드는 여러 Seaborn 플롯을 생성하고 범례를 추가하는 방법을 보여줍니다.
 #definegrid
g = sns. FacetGrid (data=tips, col=' day ', hue=' sex ', col_wrap= 2 )

#add density plots to each plot
g. map ( sns.kdeplot , ' tip ')

#add legend
g. add_legend ()

추가 리소스
Seaborn 플롯에 제목을 추가하는 방법
Seaborn에서 범례의 위치를 변경하는 방법
Seaborn 플롯의 그림 크기를 조정하는 방법