Python에서 종형 곡선을 만드는 방법
“종형 곡선”은 뚜렷한 “종” 모양을 갖는 정규 분포 의 모양에 부여되는 별명입니다 .
이 튜토리얼에서는 Python에서 종형 곡선을 만드는 방법을 설명합니다.
Python에서 종형 곡선을 만드는 방법
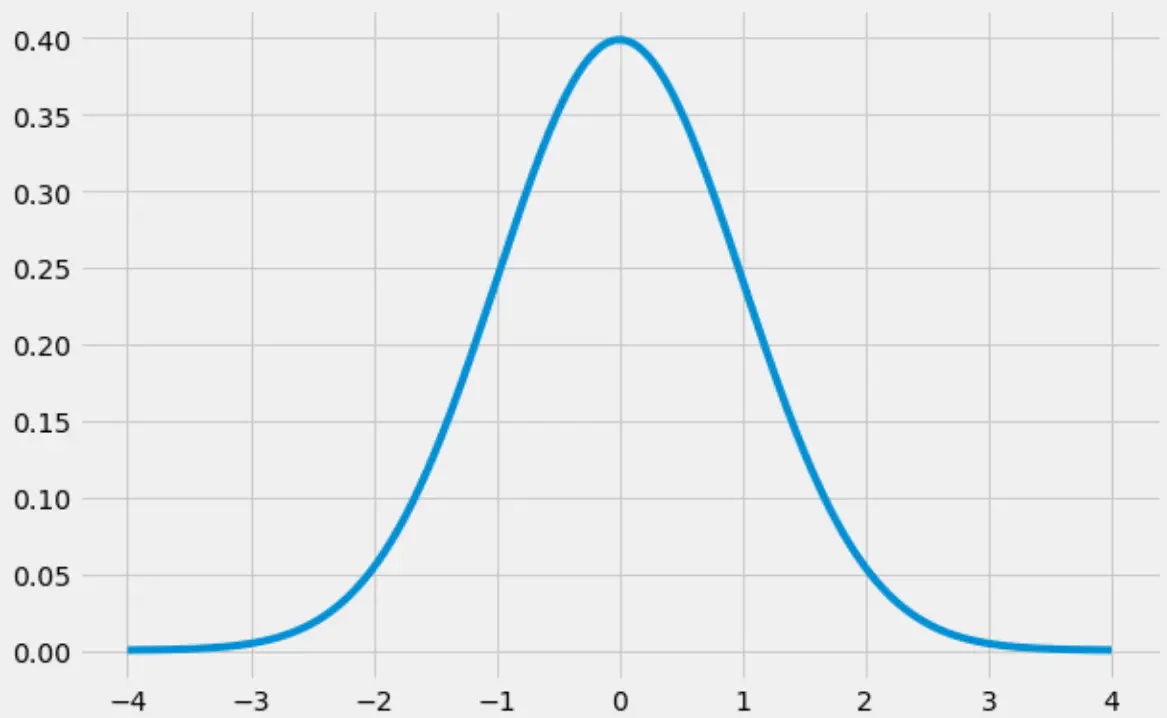
다음 코드는 numpy , scipy 및 matplotlib 라이브러리를 사용하여 종형 곡선을 만드는 방법을 보여줍니다.
 import numpy as np
import matplotlib.pyplot as plt
from scipy.stats import norm

#create range of x-values from -4 to 4 in increments of .001
x = np.arange(-4, 4, 0.001)

#create range of y-values that correspond to normal pdf with mean=0 and sd=1
y = norm.pdf(x,0,1)

#defineplot
fig, ax = plt.subplots(figsize=(9,6))
ax.plot(x,y)

#choose plot style and display the bell curve
plt.style.use('fivethirtyeight')
plt.show()
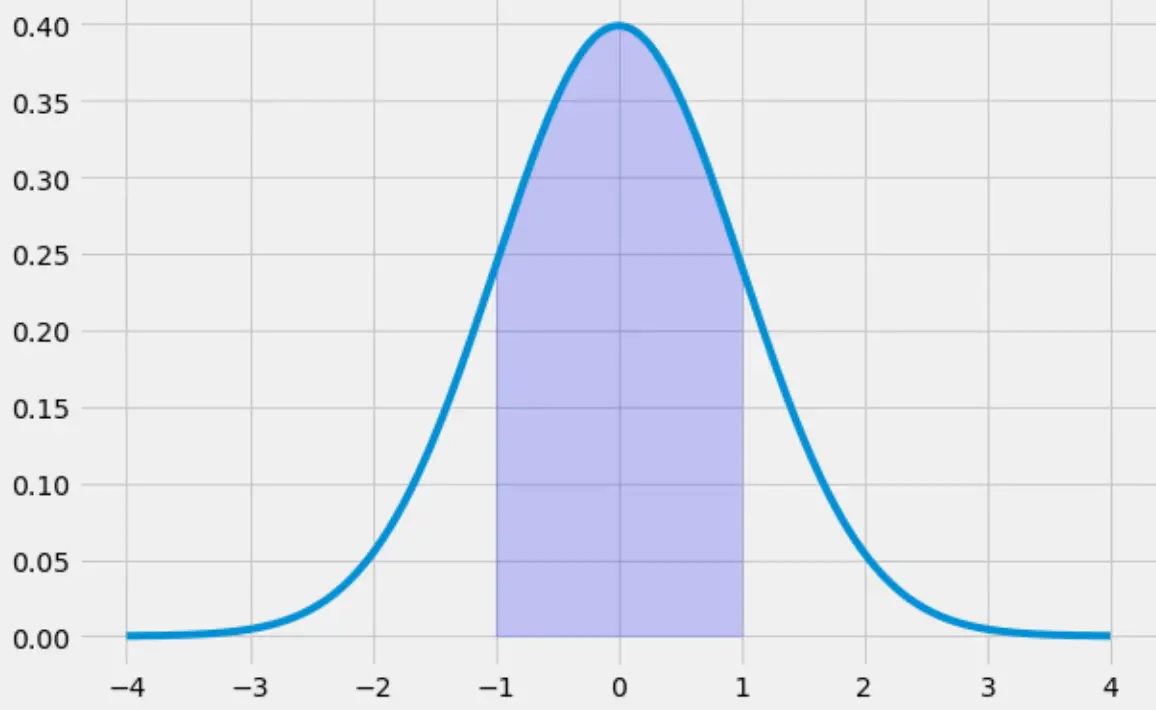
Python에서 종형 곡선을 채우는 방법
다음 코드는 -1에서 1까지 가는 종형 곡선 아래 영역을 채우는 방법을 보여줍니다.
 x = np.arange(-4, 4, 0.001)
y = norm.pdf(x,0,1)

fig, ax = plt.subplots(figsize=(9,6))
ax.plot(x,y)

#specify the region of the bell curve to fill in
x_fill = np.arange(-1, 1, 0.001)
y_fill = norm.pdf(x_fill,0,1)
ax.fill_between(x_fill,y_fill,0, alpha=0.2, color='blue')

plt.style.use('fivethirtyeight')
plt.show()
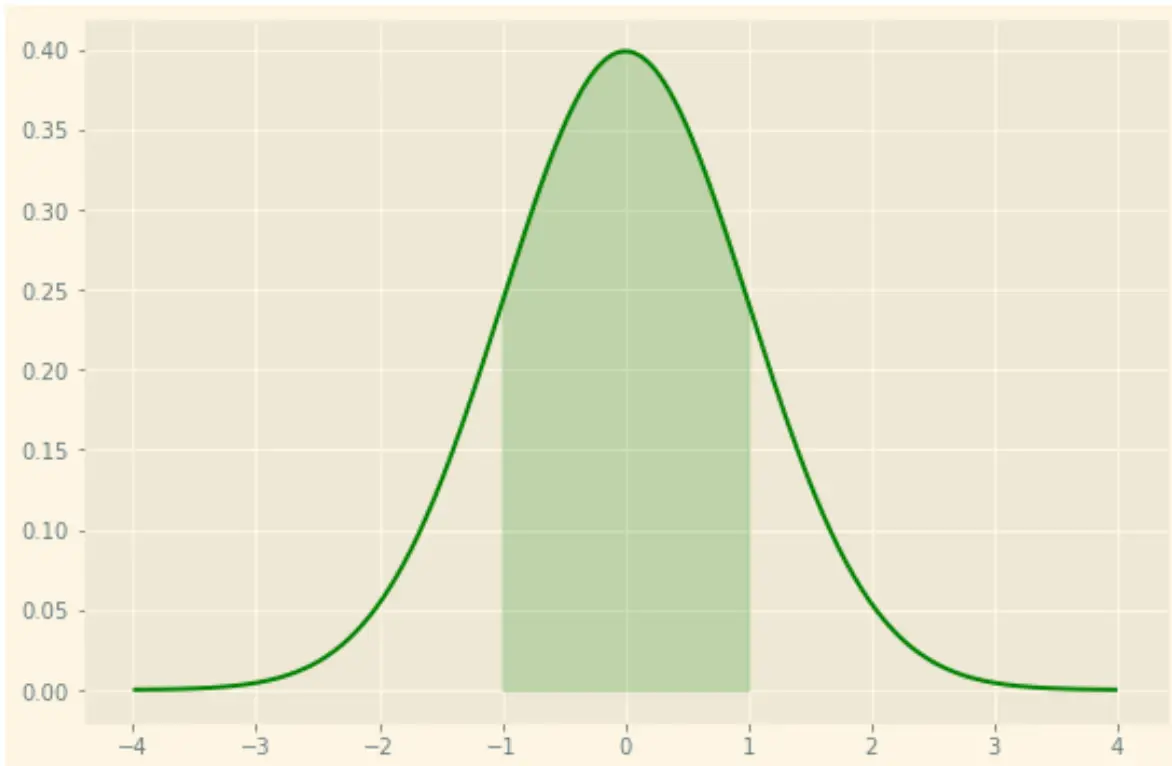
matplotlib의 다양한 스타일 옵션을 사용하여 원하는 대로 플롯 스타일을 지정할 수도 있습니다. 예를 들어 녹색 선과 녹색 음영이 있는 “햇빛” 테마를 사용할 수 있습니다.
 x = np.arange(-4, 4, 0.001)
y = norm.pdf(x,0,1)

fig, ax = plt.subplots(figsize=(9,6))
ax.plot(x,y, color=' green ')

#specify the region of the bell curve to fill in
x_fill = np.arange(-1, 1, 0.001)
y_fill = norm.pdf(x_fill,0,1)
ax.fill_between(x_fill,y_fill,0, alpha=0.2, color=' green ')

plt.style.use(' Solarize_Light2 ')
plt.show()
여기에서 matplotlib에 대한 전체 스타일시트 참조 가이드를 찾을 수 있습니다.
추가 리소스
저자 소개
벤자민 앤더슨
안녕하세요. 저는 통계학 교수를 퇴직하고 전임 통계 교사로 변신한 벤자민입니다. 통계 분야의 광범위한 경험과 전문 지식을 바탕으로 Statorials를 통해 학생들에게 힘을 실어주기 위해 지식을 공유하고 싶습니다. 더 알아보기