상관 계수를 사용하여 seaborn 산점도를 만드는 방법
다음 기본 구문을 사용하여 Seaborn에서 산점도를 생성하고 플롯에 상관 계수를 추가할 수 있습니다.
 import scipy
import matplotlib. pyplot as plt
import seaborn as sns

#calculate correlation coefficient between x and y
r = scipy. stats . pearsonr (x=df. x , y=df. y )[0]

#create scatterplot
sns. scatterplot (data=df, x=df. x , y=df. y )

#add correlation coefficient to plot
plt. text (5, 30, ' r = ' + str ( round (r,2)))
다음 예에서는 실제로 이 구문을 사용하는 방법을 보여줍니다.
예: 상관 계수를 사용하여 Seaborn 산점도 생성
다양한 농구 선수의 포인트와 어시스트를 보여주는 다음과 같은 팬더 DataFrame이 있다고 가정해 보겠습니다.
 import pandas as pd

#createDataFrame
df = pd. DataFrame ({' team ': ['A', 'A', 'A', 'A', 'B', 'C', 'C', 'C', 'D', 'D'],
                   ' points ': [12, 11, 18, 15, 14, 20, 25, 24, 32, 30],
                   ' assists ': [4, 7, 7, 8, 9, 10, 10, 12, 10, 15]})

#view DataFrame
print (df)

  team points assists
0 to 12 4
1 to 11 7
2 To 18 7
3 to 15 8
4 B 14 9
5 C 20 10
6 C 25 10
7 C 24 12
8 D 32 10
9 D 30 15
다음 구문을 사용하여 산점도를 생성하여 패스와 포인트 사이의 관계를 시각화하고 scipy 의 pearsonr() 함수를 사용하여 이 두 변수 사이의 상관 계수를 계산할 수 있습니다.
 import scipy
import matplotlib. pyplot as plt
import seaborn as sns

#calculate correlation coefficient between assists and points
r = scipy. stats . pearsonr (x=df. assists , y=df. points )[0]

#create scatterplot
sns. scatterplot (data=df, x=df. assists , y=df. points )

#add correlation coefficient to plot
plt. text (5, 30, ' r = ' + str ( round (r,2)))
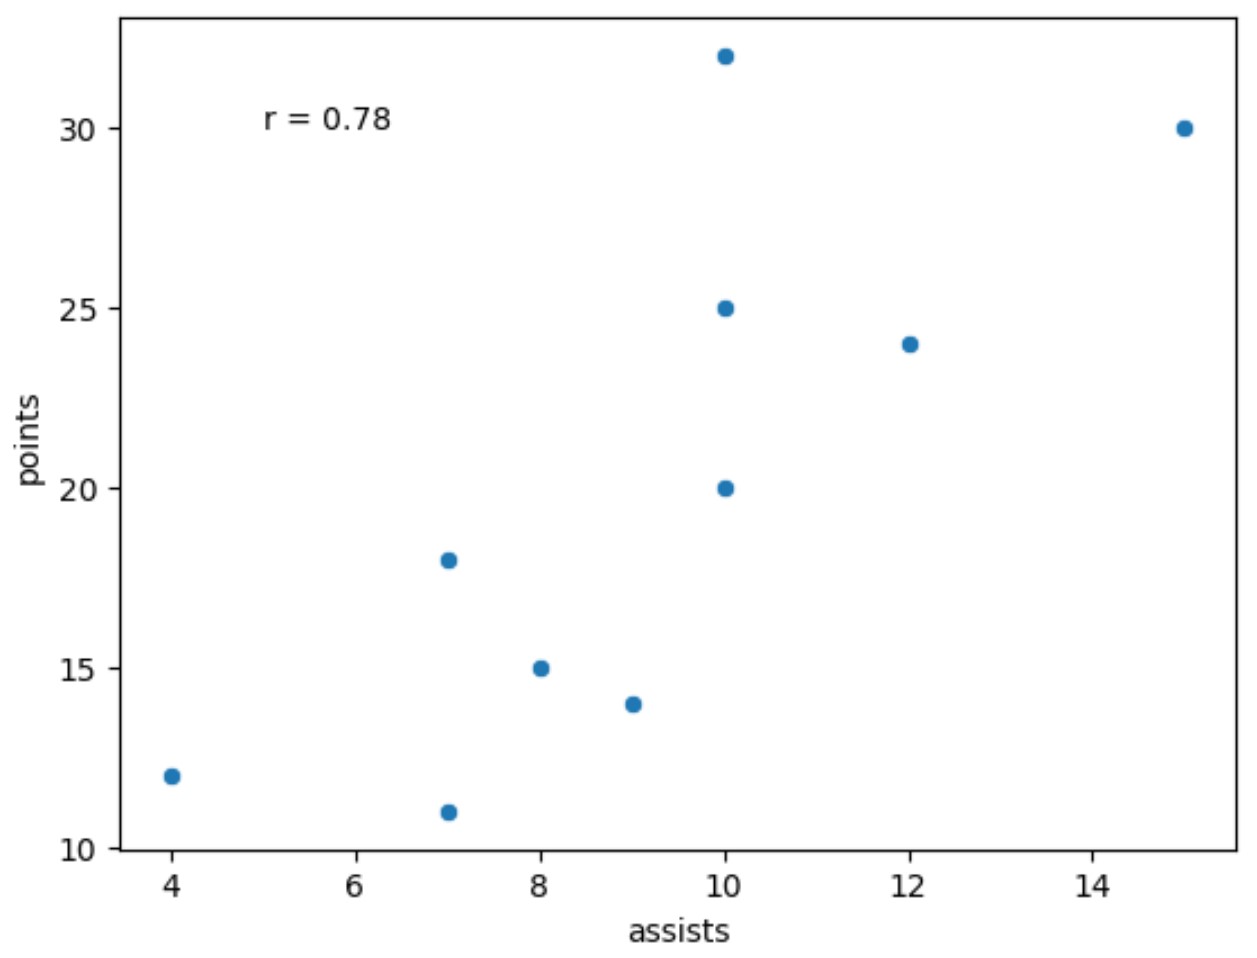
결과에서 어시스트와 포인트 간의 Pearson 상관계수는 0.78 임을 알 수 있습니다.
관련 항목: “강한” 상관 관계로 간주되는 것은 무엇입니까?
상관 계수를 소수점 이하 두 자리로 반올림하기 위해 round() 함수를 사용했습니다.
자유롭게 다른 소수점 이하 자릿수로 반올림할 수 있으며, 플롯에서 상관 계수의 글꼴 크기를 변경하려면 글꼴 크기 인수를 자유롭게 사용할 수도 있습니다.
 import scipy
import matplotlib. pyplot as plt
import seaborn as sns

#calculate correlation coefficient between assists and points
r = scipy. stats . pearsonr (x=df. assists , y=df. points )[0]

#create scatterplot
sns. scatterplot (data=df, x=df. assists , y=df. points )

#add correlation coefficient to plot
plt. text (5, 30, ' r= '+ str ( round (r,4)), fontsize= 20 ))
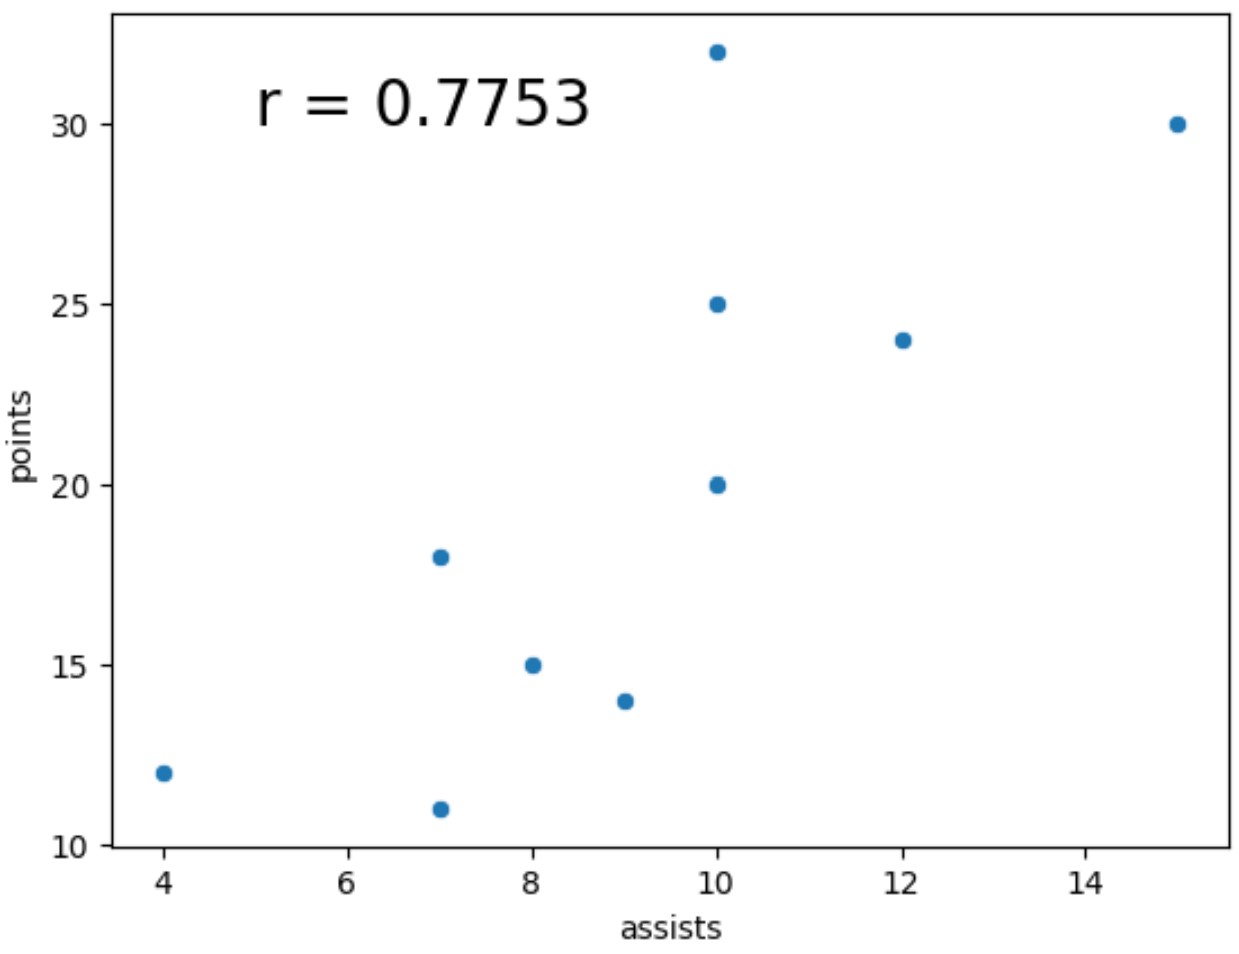
이제 상관 계수는 소수점 네 자리로 반올림되었으며 글꼴 크기는 이전 예보다 훨씬 커졌습니다.
참고 : 여기에서 seaborn 산점도() 함수에 대한 전체 문서를 찾을 수 있습니다.
추가 리소스
다음 튜토리얼에서는 seaborn에서 다른 일반적인 기능을 수행하는 방법을 설명합니다.
Seaborn에서 분포를 그리는 방법
Seaborn에서 x축의 상자 그림을 주문하는 방법
Seaborn 플롯에 테이블을 추가하는 방법
저자 소개
벤자민 앤더슨
안녕하세요. 저는 통계학 교수를 퇴직하고 전임 통계 교사로 변신한 벤자민입니다. 통계 분야의 광범위한 경험과 전문 지식을 바탕으로 Statorials를 통해 학생들에게 힘을 실어주기 위해 지식을 공유하고 싶습니다. 더 알아보기