Matplotlib에서 종횡비를 설정하는 방법
matplotlib 플롯의 종횡비는 축 스케일링의 측면, 즉 x 단위에 대한 y 단위의 비율을 나타냅니다.
이 비율은 matplotlib.axes.Axes.set_aspect() 함수를 사용하여 수정할 수 있습니다.
내부적으로 set_aspect() 함수는 실제로 데이터 좌표계를 변경하지만 실제로는 일반적으로 디스플레이 좌표계를 변경하려고 합니다.
이 변환을 용이하게 하기 위해 다음 코드를 사용할 수 있습니다.
 #define y-unit to x-unit ratio
ratio = 1.0

#get x and y limits
x_left, x_right = ax. get_xlim ()
y_low, y_high = ax. get_ylim ()

#set aspect ratio
ax. set_aspect ( abs ((x_right-x_left)/(y_low-y_high))*ratio)
실제로 이 기능을 사용하는 예를 살펴보겠습니다.
1단계: 기본 Matplotlib 플롯 생성
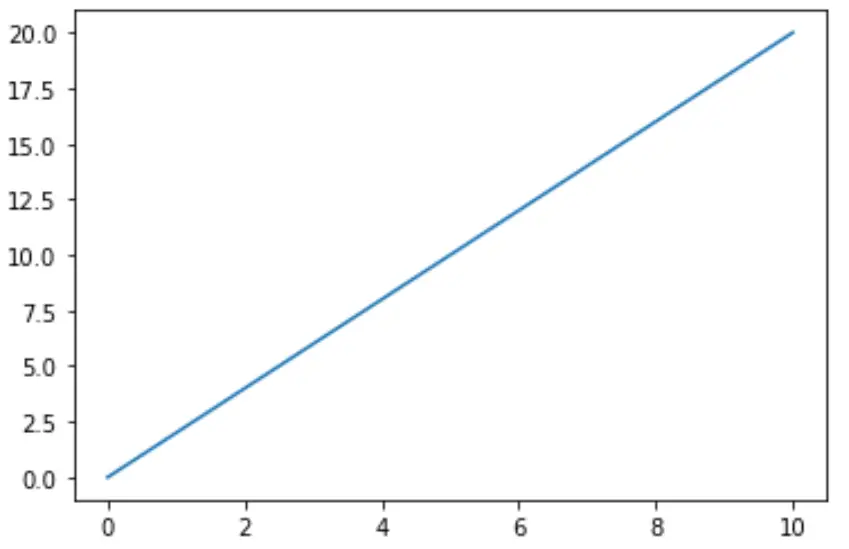
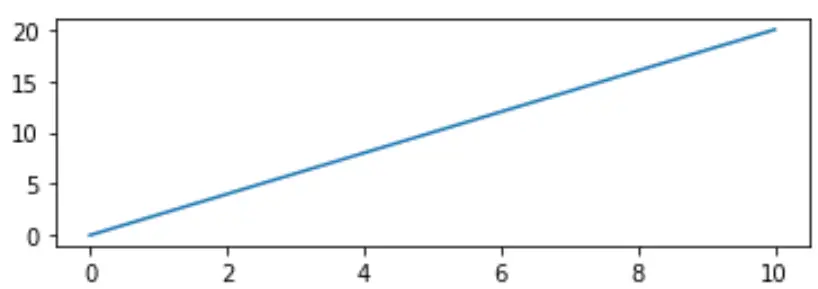
먼저 Matplotlib을 사용하여 간단한 꺾은선형 차트를 만들어 보겠습니다.
 import matplotlib.pyplot as plt

#define matplotlib figure and axis
fig, ax = plt. subplots ()

#create simple line plot
ax. plot ([0, 10],[0, 20])

#displayplot
plt. show ()
2단계: 가로 세로 비율 설정(잘못된 방법)
x축이 y축보다 길다는 점에 유의하세요. 종횡비를 1로 설정해 보겠습니다. 즉, x축과 y축이 동일해야 합니다.
 import matplotlib.pyplot as plt

#define matplotlib figure and axis
fig, ax = plt. subplots ()

#create simple line plot
ax. plot ([0, 10],[0, 20])

#attempt to set aspect ratio to 1
ax. set_aspect (1)

#displayplot
plt. show ()
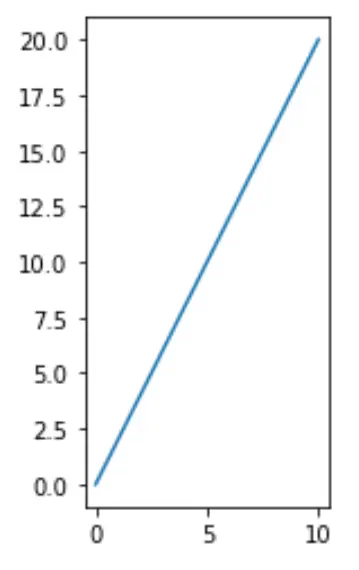
이는 예상대로 작동하지 않았습니다. y축이 x축보다 훨씬 깁니다.
3단계: 화면비 설정(올바른 방법)
다음 코드는 간단한 계산을 사용하여 올바른 종횡비를 설정하는 방법을 보여줍니다.
 import matplotlib.pyplot as plt

#define matplotlib figure and axis
fig, ax = plt. subplots ()

#create simple line plot
ax. plot ([0, 10],[0, 20])

#set aspect ratio to 1
ratio = 1.0
x_left, x_right = ax. get_xlim ()
y_low, y_high = ax. get_ylim ()
ax. set_aspect ( abs ((x_right-x_left)/(y_low-y_high))*ratio)

#displayplot
plt. show ()
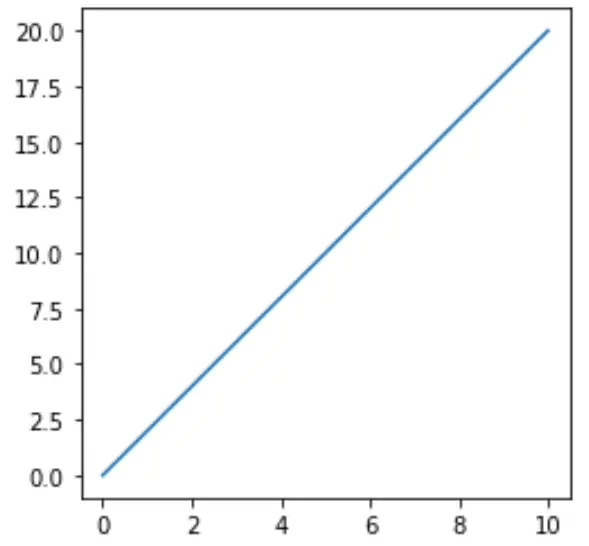
이 플롯은 우리가 예상했던 종횡비를 가지고 있습니다. x축과 y축의 길이가 같습니다.
4단계: 원하는 대로 화면 비율을 조정하세요.
y축이 x축보다 길기를 원한다면 가로세로 비율을 1보다 큰 숫자로 지정하면 됩니다.
 import matplotlib.pyplot as plt

#define matplotlib figure and axis
fig, ax = plt. subplots ()

#create simple line plot
ax. plot ([0, 10],[0, 20])

#set aspect ratio to 3
ratio = 3
x_left, x_right = ax. get_xlim ()
y_low, y_high = ax. get_ylim ()
ax. set_aspect ( abs ((x_right-x_left)/(y_low-y_high))*ratio)

#displayplot
plt. show ()
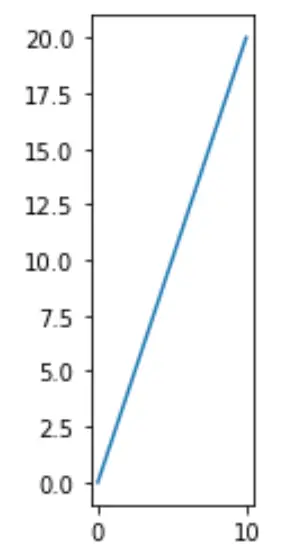
그리고 y축을 x축보다 짧게 하려면 종횡비를 1보다 작은 숫자로 지정하면 됩니다.
 import matplotlib.pyplot as plt

#define matplotlib figure and axis
fig, ax = plt. subplots ()

#create simple line plot
ax. plot ([0, 10],[0, 20])

#set aspect ratio to .3
ratio = .3
x_left, x_right = ax. get_xlim ()
y_low, y_high = ax. get_ylim ()
ax. set_aspect ( abs ((x_right-x_left)/(y_low-y_high))*ratio)

#displayplot
plt. show ()
여기에서 더 많은 Matplotlib 튜토리얼을 찾을 수 있습니다.
저자 소개
벤자민 앤더슨
안녕하세요. 저는 통계학 교수를 퇴직하고 전임 통계 교사로 변신한 벤자민입니다. 통계 분야의 광범위한 경험과 전문 지식을 바탕으로 Statorials를 통해 학생들에게 힘을 실어주기 위해 지식을 공유하고 싶습니다. 더 알아보기