Python에서 파레토 차트를 만드는 방법(단계별)
파레토 차트는 범주의 순서 빈도와 범주의 누적 빈도를 표시하는 차트 유형입니다.
이 튜토리얼에서는 Python에서 파레토 차트를 만드는 단계별 예를 제공합니다.
1단계: 데이터 생성
350명의 사람들에게 A, B, C, D, E 브랜드 중에서 가장 좋아하는 시리얼 브랜드를 식별하도록 요청하는 설문조사를 실시한다고 가정해 보겠습니다.
설문조사 결과를 보관하기 위해 다음 pandas DataFrame을 만들 수 있습니다.
 import pandas as pd

#createDataFrame
df = pd. DataFrame ({' count ': [97, 140, 58, 6, 17, 32]})
df. index = ['B', 'A', 'C', 'F', 'E', 'D']

#sort DataFrame by count descending
df = df. sort_values (by=' count ', ascending= False )

#add column to display cumulative percentage
df[' cumperc '] = df[' count ']. cumsum ()/df[' count ']. sum ()*100

#view DataFrame
df

	count cumperc
At 140 40.000000
B 97 67.714286
C 58 84.285714
D 32 93.428571
E 17 98.285714
F 6 100.000000
2단계: 파레토 차트 만들기
다음 코드를 사용하여 Pareto 차트를 만들 수 있습니다.
 import matplotlib. pyplot as plt
from matplotlib. ticker import PercentFormatter

#define aesthetics for plot
color1 = ' steelblue '
color2 = ' red '
line_size = 4

#create basic bar plot
fig, ax = plt. subplots ()
ax. bar (df. index , df[' count '], color=color1)

#add cumulative percentage line to plot
ax2 = ax. twinx ()
ax2. plot ( df.index , df[' cumperc '], color=color2, marker=" D ", ms=line_size)
ax2. yaxis . set_major_formatter (PercentFormatter())

#specify axis colors
ax. tick_params (axis=' y ', colors=color1)
ax2. tick_params (axis=' y ', colors=color2)

#display Pareto chart
plt. show ()
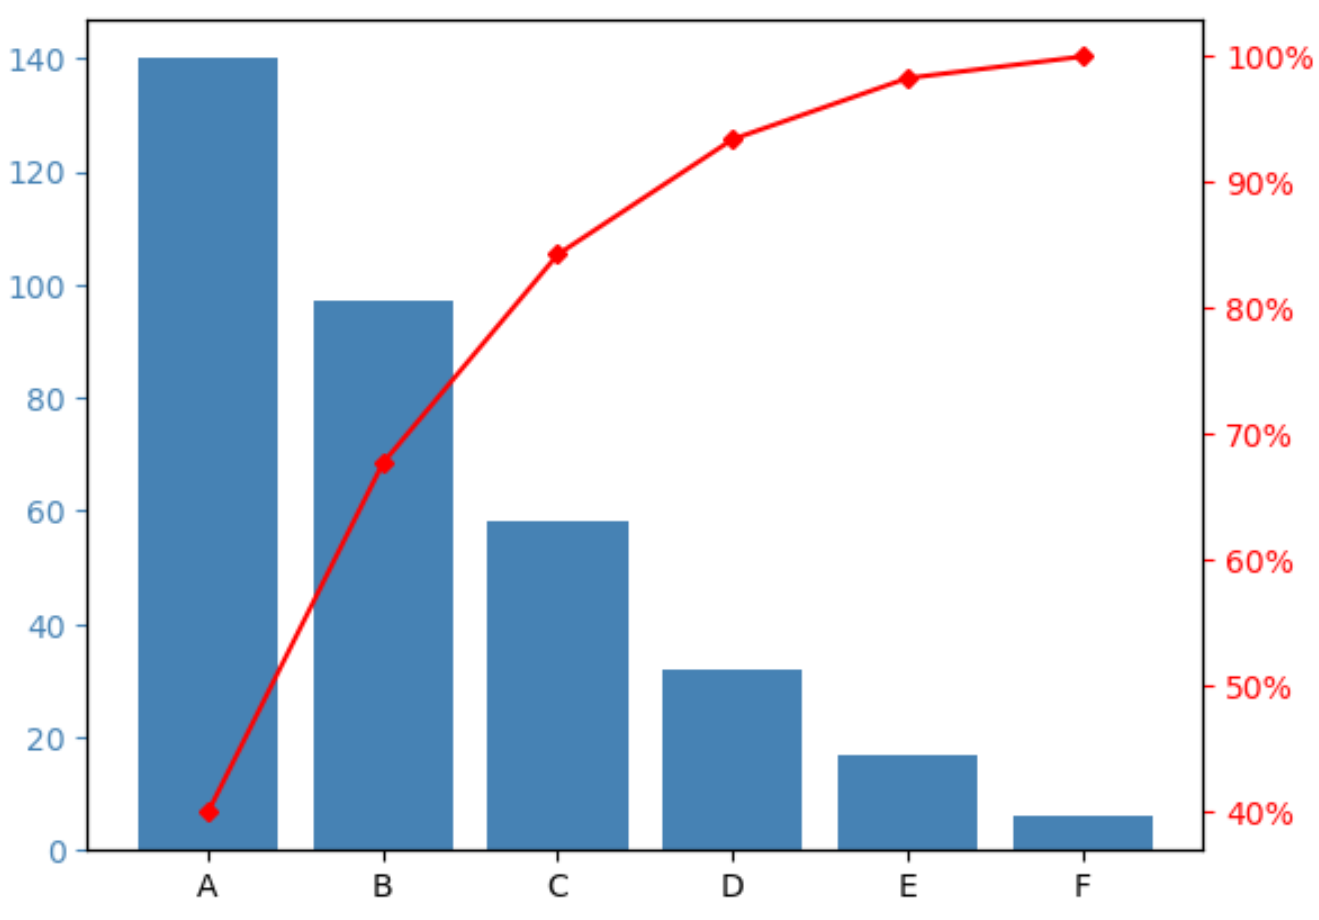
X축에는 빈도가 가장 높은 것부터 가장 낮은 것 순으로 다양한 브랜드가 표시됩니다.
왼쪽 y축은 각 브랜드의 빈도를 나타내고 오른쪽 y축은 브랜드의 누적 빈도를 나타냅니다.
예를 들어 다음을 볼 수 있습니다.
- 브랜드 A는 전체 설문 조사 응답의 약 40%를 나타냅니다.
- 브랜드 A와 B는 전체 설문조사 응답의 약 70%를 차지합니다.
- 브랜드 A, B, C는 전체 설문조사 응답의 약 85%를 차지합니다.
등등.
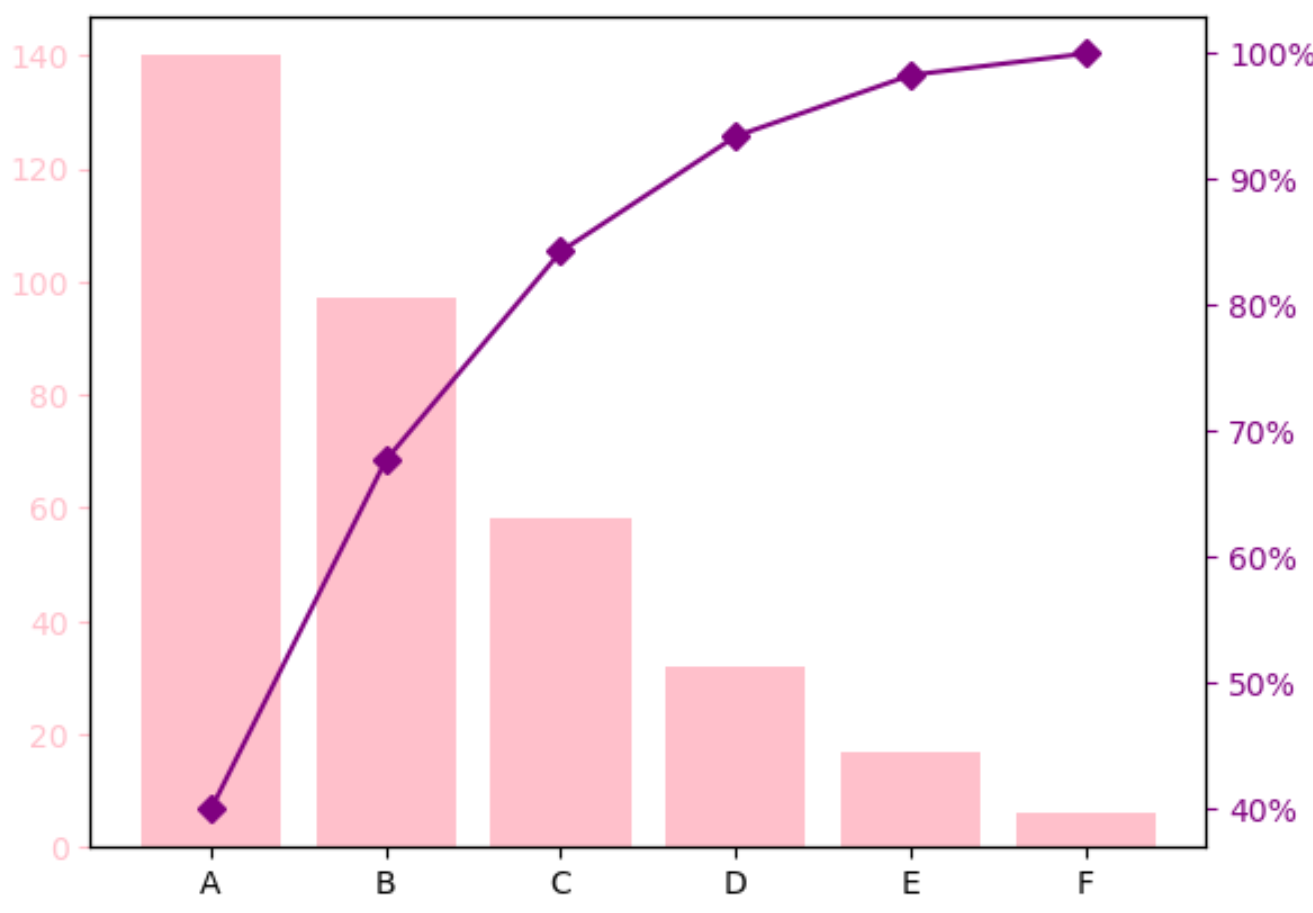
3단계: Pareto 차트 사용자 지정(선택 사항)
막대 색상과 누적 백분율 선의 크기를 변경하여 파레토 차트를 원하는 모양으로 만들 수 있습니다.
예를 들어 막대를 분홍색으로, 선을 보라색으로 약간 더 두껍게 변경할 수 있습니다.
 import matplotlib. pyplot as plt
from matplotlib. ticker import PercentFormatter

#define aesthetics for plot
color1 = ' pink '
color2 = ' purple '
line_size = 6

#create basic bar plot
fig, ax = plt. subplots ()
ax. bar (df. index , df[' count '], color=color1)

#add cumulative percentage line to plot
ax2 = ax. twinx ()
ax2. plot (df.index , df[' cumperc '], color=color2, marker=" D ", ms=line_size )
ax2. yaxis . set_major_formatter (PercentFormatter())

#specify axis colors
ax. tick_params (axis=' y ', colors=color1)
ax2. tick_params (axis=' y ', colors=color2)

#display Pareto chart
plt. show ()
추가 리소스
다음 튜토리얼에서는 Python에서 다른 일반적인 시각화를 만드는 방법을 설명합니다.
Python에서 종형 곡선을 만드는 방법
Python에서 Ogive 차트를 만드는 방법
Python에서 줄기와 잎 그림을 만드는 방법
저자 소개
벤자민 앤더슨
안녕하세요. 저는 통계학 교수를 퇴직하고 전임 통계 교사로 변신한 벤자민입니다. 통계 분야의 광범위한 경험과 전문 지식을 바탕으로 Statorials를 통해 학생들에게 힘을 실어주기 위해 지식을 공유하고 싶습니다. 더 알아보기