Python에서 감마 분포를 그리는 방법(예제 포함)
통계에서 감마 분포는 대기 시간과 관련된 확률을 모델링하는 데 자주 사용됩니다.
다음 예는 scipy.stats.gamma() 함수를 사용하여 Python에서 하나 이상의 감마 분포를 그리는 방법을 보여줍니다.
예 1: 감마 분포 도표화
다음 코드는 Python에서 모양 매개변수가 5 이고 척도 매개변수가 3 인 감마 분포를 그리는 방법을 보여줍니다.
 import numpy as np
import scipy. stats as stats
import matplotlib. pyplot as plt

#define x-axis values
x = np. linspace (0, 40, 100)

#calculate pdf of Gamma distribution for each x-value
y = stats. gamma . pdf (x, a= 5 , scale= 3 )

#create plot of Gamma distribution
plt. plot (x, y)

#displayplot
plt. show ()
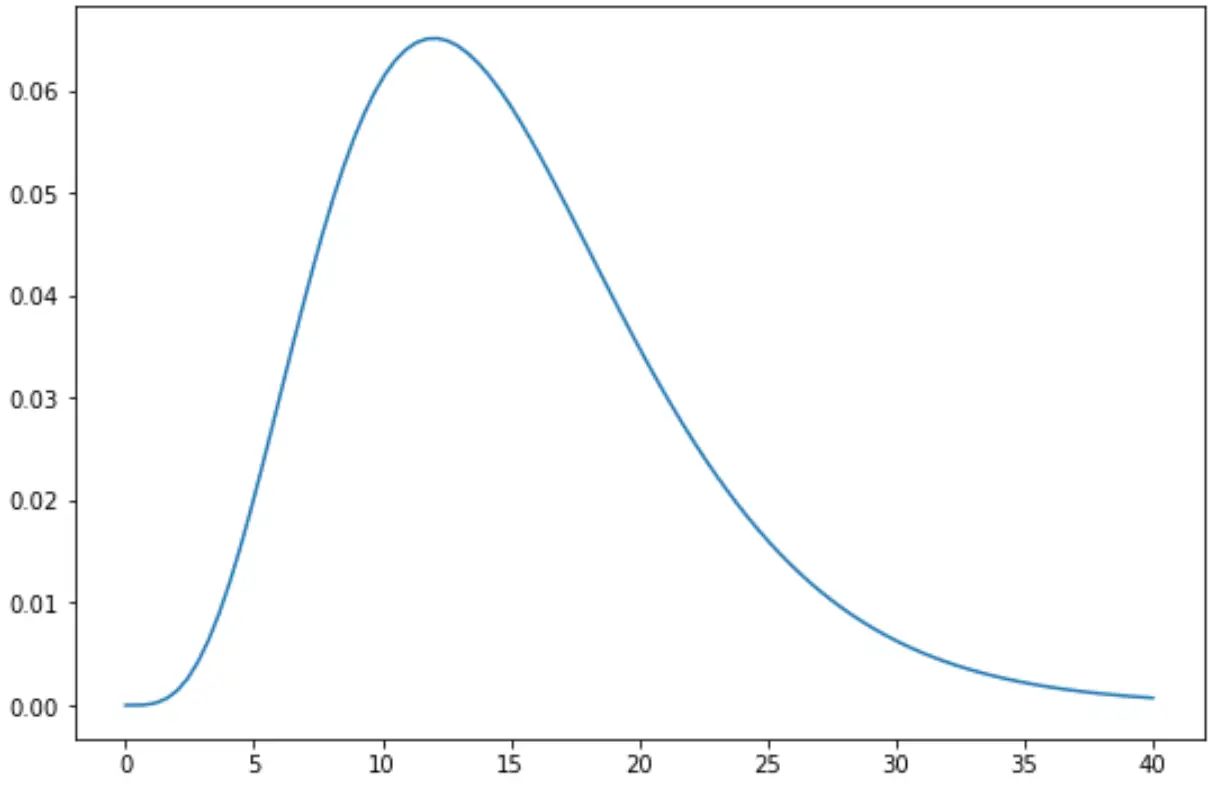
x축은 감마 분포 확률변수가 취할 수 있는 잠재적인 값을 표시하고, y축은 형상 매개변수가 5, 척도 매개변수가 3인 감마 분포의 해당 PDF 값을 표시합니다.
예 2: 여러 감마 분포 도표화
다음 코드는 다양한 모양 및 척도 매개변수를 사용하여 여러 감마 분포를 그리는 방법을 보여줍니다.
 import numpy as np
import scipy. stats as stats
import matplotlib. pyplot as plt

#define three Gamma distributions
x = np. linspace (0, 40, 100)
y1 = stats. gamma . pdf (x, a= 5 , scale= 3 )
y2 = stats. gamma . pdf (x, a= 2 , scale= 5 )
y3 = stats. gamma . pdf (x, a= 4 , scale= 2 )

#add lines for each distribution
plt. plot (x, y1, label= shape=5, scale=3 ')
plt. plot (x, y2, label=' shape=2, scale=5 ')
plt. plot (x, y3, label=' shape=4, scale=2 ')

#add legend
plt. legend ()

#displayplot
plt. show ()
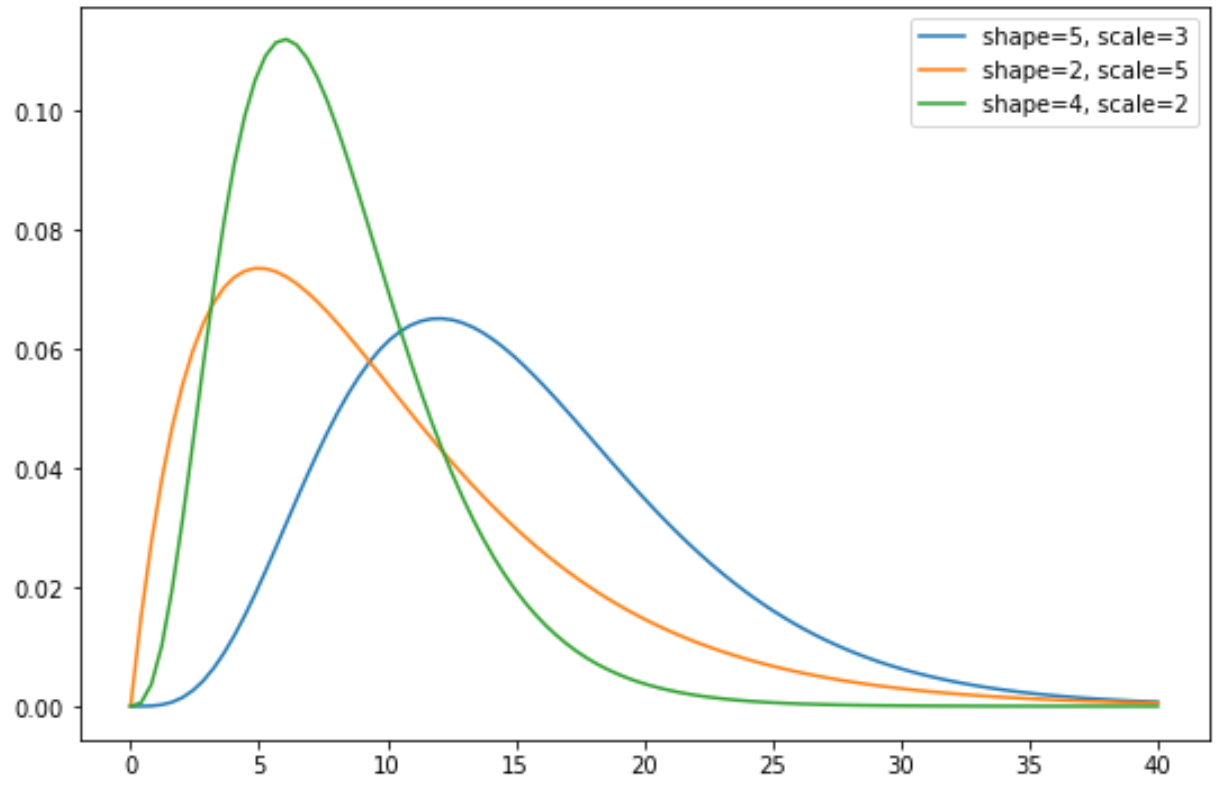
감마 분포의 모양은 모양 및 척도 매개변수에 따라 크게 달라질 수 있습니다.
추가 리소스
다음 튜토리얼에서는 Python에서 다른 일반적인 분포를 그리는 방법을 설명합니다.
저자 소개
벤자민 앤더슨
안녕하세요. 저는 통계학 교수를 퇴직하고 전임 통계 교사로 변신한 벤자민입니다. 통계 분야의 광범위한 경험과 전문 지식을 바탕으로 Statorials를 통해 학생들에게 힘을 실어주기 위해 지식을 공유하고 싶습니다. 더 알아보기