R에서 facet_wrap을 사용하는 방법(예제 포함)
Facet_wrap() 함수는 ggplot2에서 다중 패널 플롯을 생성하는 데 사용할 수 있습니다.
이 함수는 다음 기본 구문을 사용합니다.
 library (ggplot2)

ggplot(df, aes (x_var, y_var)) +
  geom_point() +
  facet_wrap(vars(category_var))
다음 예에서는 R에 내장된 mpg 데이터세트와 함께 이 함수를 사용하는 방법을 보여줍니다.
 #view first six rows of mpg dataset
head(mpg)

manufacturer model displ year cyl trans drv cty hwy fl class

audi a4 1.8 1999 4 auto(l5) f 18 29 p compact
audi a4 1.8 1999 4 manual(m5) f 21 29 p compact
audi a4 2.0 2008 4 manual(m6) f 20 31 p compact
audi a4 2.0 2008 4 auto(front) f 21 30 p compact
audi a4 2.8 1999 6 auto(l5) f 16 26 p compact
audi a4 2.8 1999 6 manual(m5) f 18 26 p compact
예시 1: facet_wrap() 기본 함수
다음 코드는 displ을 x축 변수로, hwy 를 y축 변수로, class를 그룹화 변수로 사용하여 ggplot2에서 여러 산점도를 생성하는 방법을 보여줍니다.
 ggplot(mpg, aes (displ, hwy)) +
  geom_point() +
  facet_wrap(vars(class))

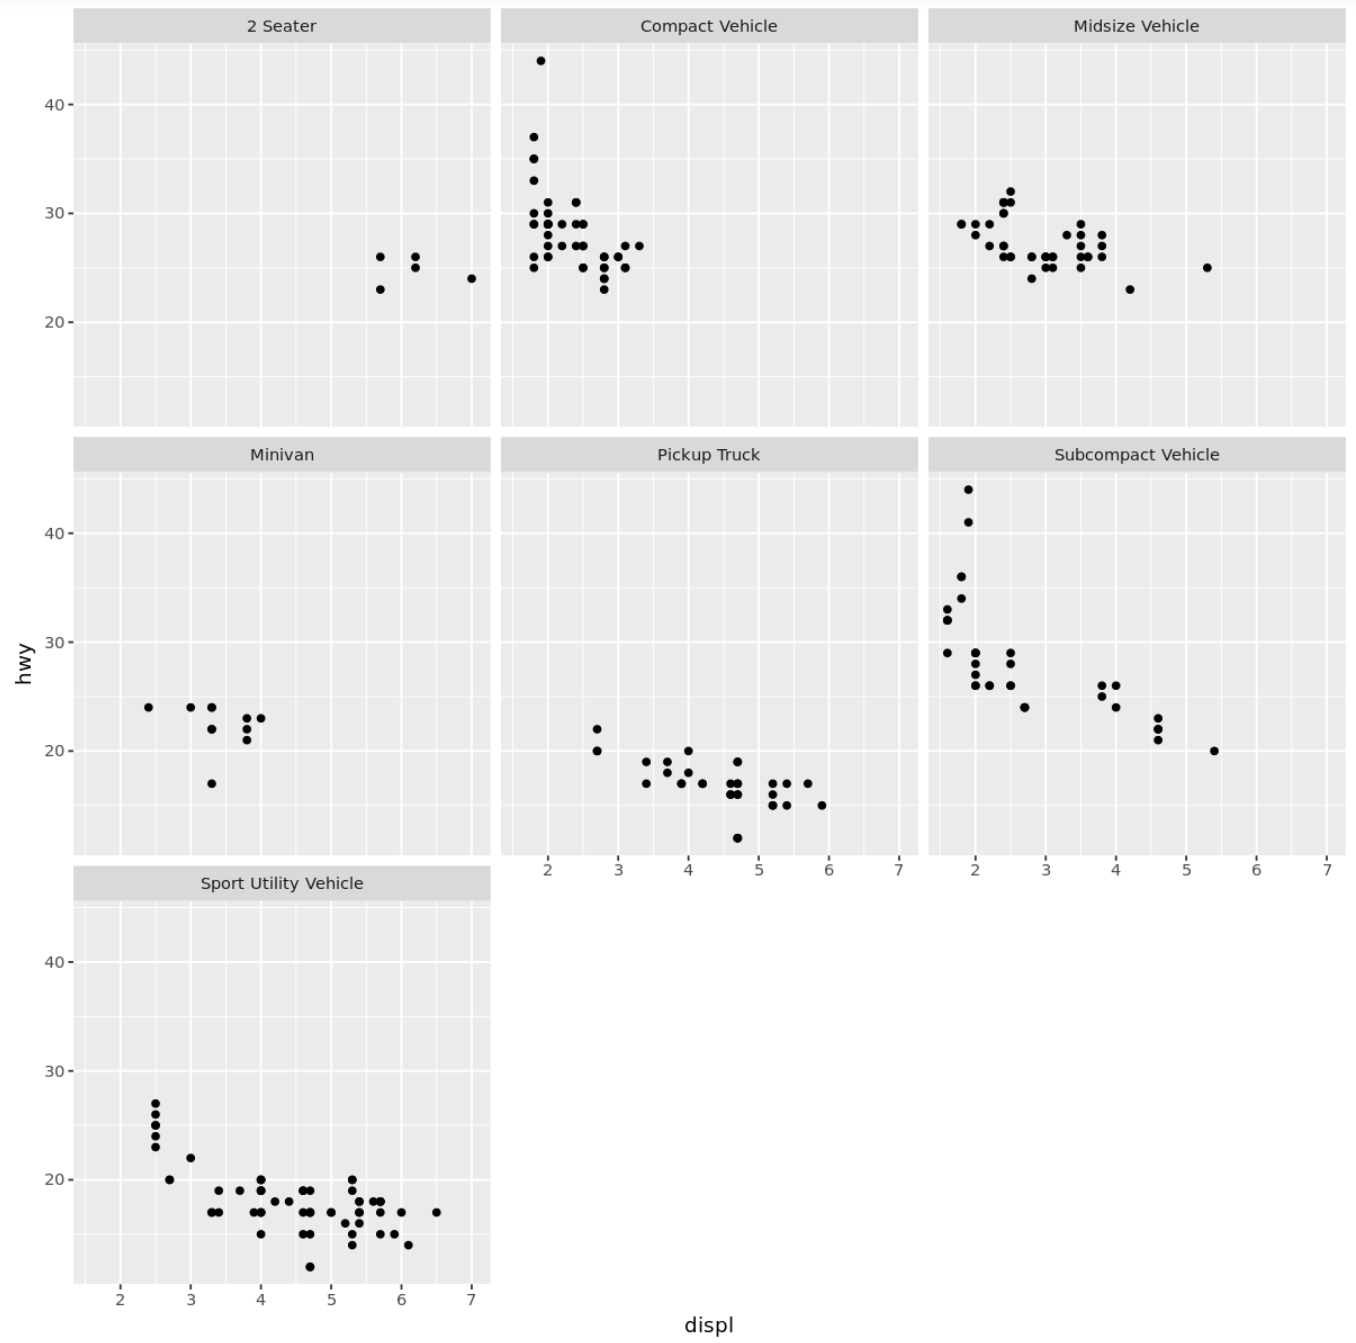
예 2: 맞춤 라벨 사용
다음 코드는 플롯 제목에 대한 사용자 정의 레이블과 함께 facet_wrap() 함수를 사용하는 방법을 보여줍니다.
 #define custom labels
plot_names <- c('2seater' = "2 Seater",
                'compact' = "Compact Vehicle",
                'midsize' = "Midsize Vehicle",
                'minivan' = "Minivan",
                'pickup' = "Pickup Truck",
                'subcompact' = "Subcompact Vehicle",
                'suv' = "Sport Utility Vehicle")

#use facet_wrap with custom plot labels
ggplot(mpg, aes (displ, hwy)) +
  geom_point() +
  facet_wrap(vars(class), labeller = as_labeller (plot_names))
예 3: 사용자 정의 배율 사용
다음 코드는 각 개별 플롯에 대한 사용자 정의 배율과 함께 Facet_wrap() 함수를 사용하는 방법을 보여줍니다.
 #use facet_wrap with custom scales
ggplot(mpg, aes (displ, hwy)) +
  geom_point() +
  facet_wrap(vars(class), scales=' free ')

예시 4: 사용자 정의 명령 사용
다음 코드는 개별 플롯에 대한 사용자 정의 순서와 함께 Facet_wrap() 함수를 사용하는 방법을 보여줍니다.
 #define order for plots
mpg <- within(mpg, class <- factor(class, levels=c(' compact ', ' 2seater ', ' suv ',
                                                   ' subcompact ', ' pickup ',
                                                   ' minivan ', ' midsize ')))

#use facet_wrap with custom order
ggplot(mpg, aes (displ, hwy)) +
  geom_point() +
  facet_wrap(vars(class))
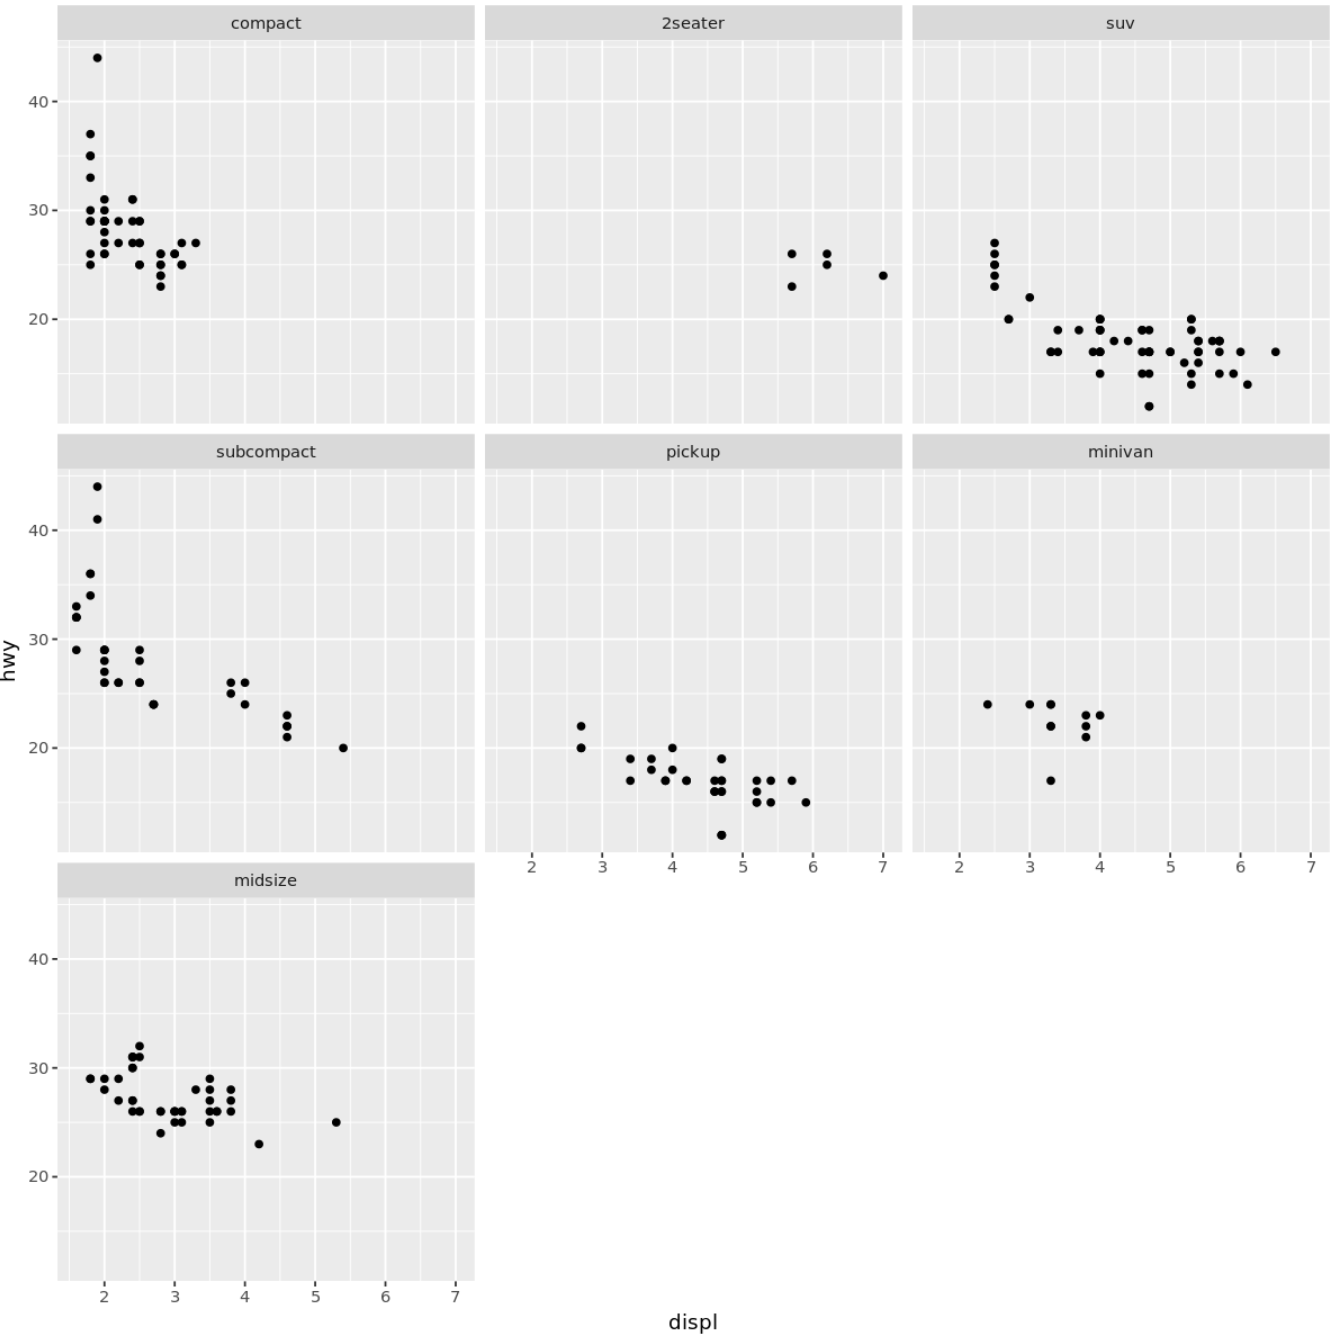
플롯은 우리가 지정한 정확한 순서로 나타납니다.
추가 리소스
ggplot2에서 글꼴 크기를 변경하는 방법
ggplot2에서 범례를 제거하는 방법
ggplot2에서 축 레이블을 회전하는 방법
저자 소개
벤자민 앤더슨
안녕하세요. 저는 통계학 교수를 퇴직하고 전임 통계 교사로 변신한 벤자민입니다. 통계 분야의 광범위한 경험과 전문 지식을 바탕으로 Statorials를 통해 학생들에게 힘을 실어주기 위해 지식을 공유하고 싶습니다. 더 알아보기