히스토그램의 그림 크기를 변경하는 방법 pandas
figsize 인수를 사용하여 pandas에서 생성된 히스토그램 그림의 크기를 변경할 수 있습니다.
 import matplotlib. pyplot as plt

#specify figure size (width, height)
fig = plt. figure (figsize=(8,3))
ax = fig. gca ()

#create histogram using specified figure size
df[' my_column ']. hist (ax=ax)
다음 예에서는 실제로 figsize 인수를 사용하는 방법을 보여줍니다.
예: 팬더 히스토그램 그림의 크기를 변경하는 방법
다음과 같은 팬더 DataFrame이 있다고 가정합니다.
 import pandas as pd

#createDataFrame
df = pd. DataFrame ({' player ': ['A', 'B', 'C', 'D', 'E', 'F', 'G', 'H',
                              'I', 'J', 'K', 'L', 'M', 'N', 'O', 'P'],
                   ' points ': [10, 12, 14, 15, 15, 15, 16, 17,
                              19, 19, 24, 24, 28, 30, 34, 34]})

#view first five rows of DataFrame
print ( df.head ())

  player points
0 to 10
1 B 12
2 C 14
3 D 15
4 E 15
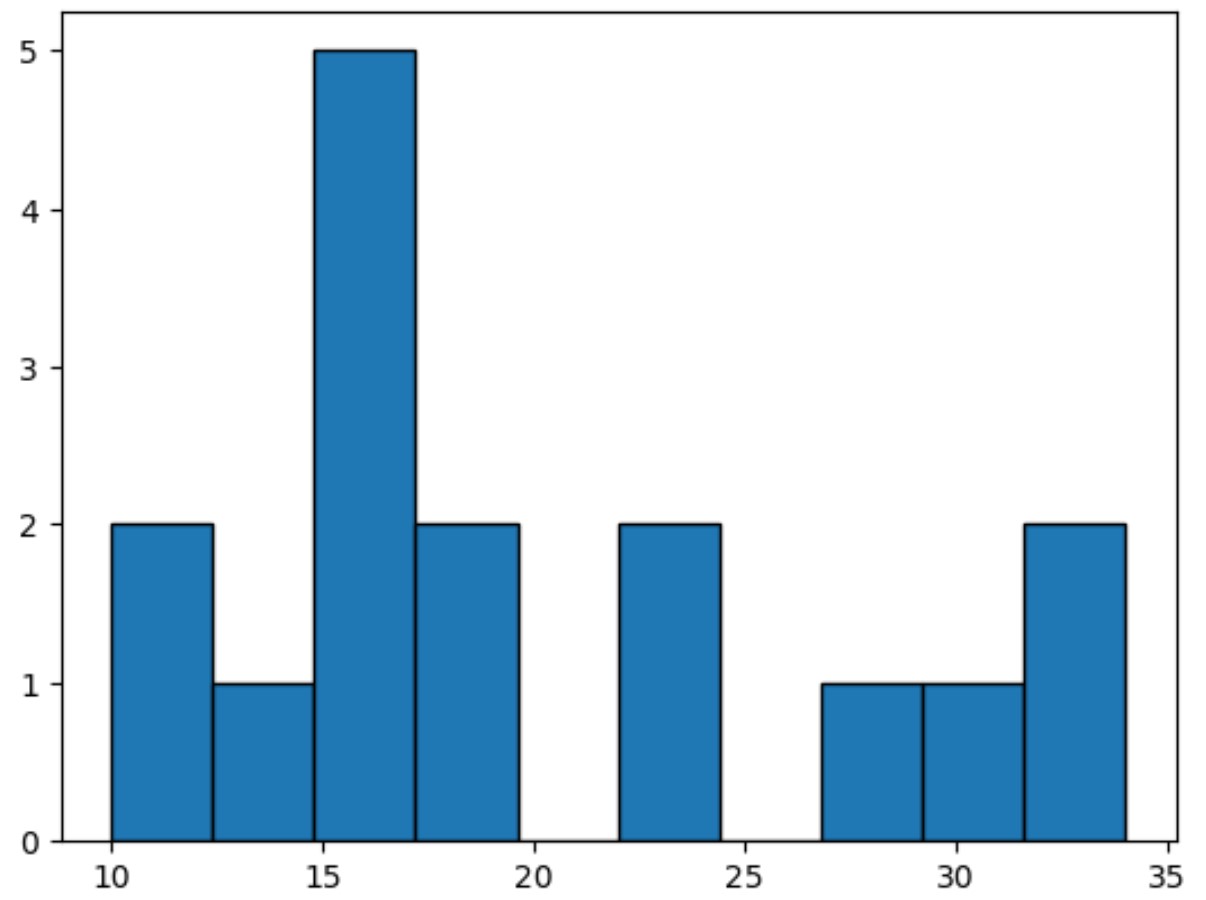
points 변수에 대한 히스토그램을 생성하면 pandas는 자동으로 그림의 너비 로 6.4를 사용하고 높이 로 4.8을 사용합니다.
 import matplotlib. pyplot as plt

#create histogram for variable points
df[' points ']. hist (grid= False ,edgecolor=' black ')
그러나 figsize 인수를 사용하여 Figure의 너비와 높이를 변경할 수 있습니다.
 import matplotlib. pyplot as plt

#specify figure size (width, height)
fig = plt. figure (figsize=(8,3))
ax = fig. gca ()

#create histogram using specified figure size
df[' points ']. hist ( grid= False , edgecolor=' black ', ax=ax)
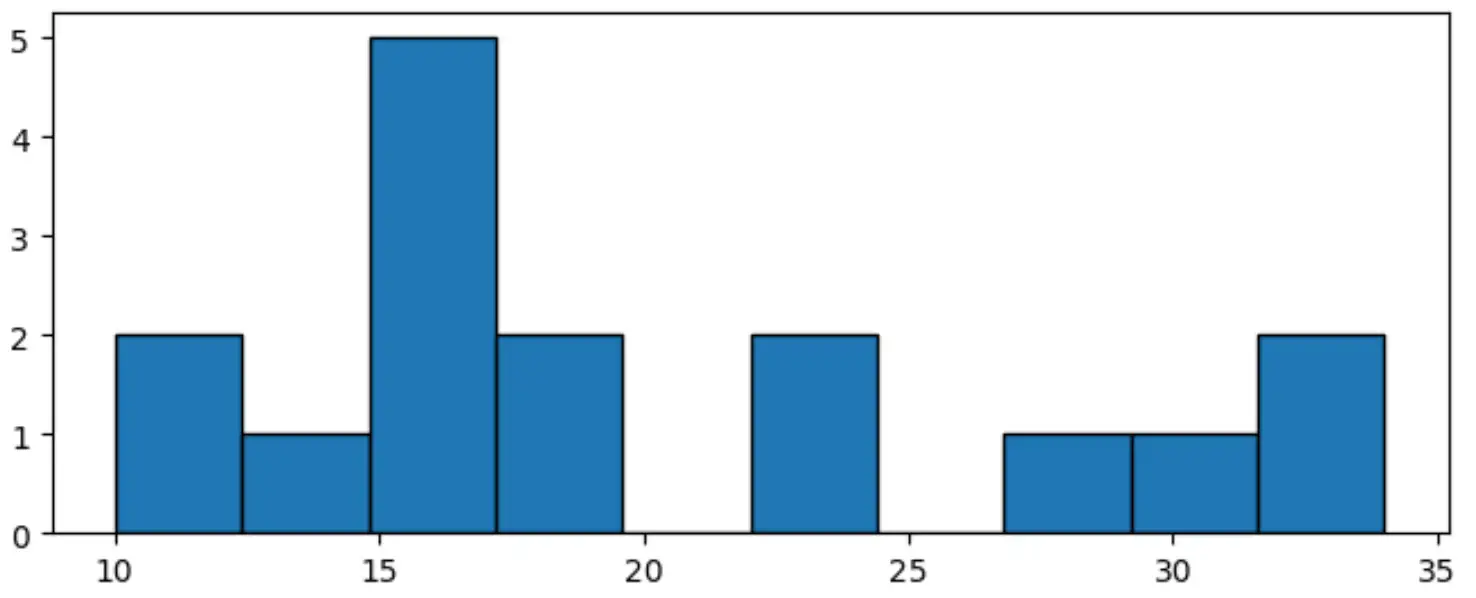
이 특정 히스토그램의 너비 는 8 이고 높이는 3 입니다.
figsize 인수를 사용하여 높이가 너비보다 큰 Figure를 만들 수도 있습니다.
 import matplotlib. pyplot as plt

#specify figure size (width, height)
fig = plt. figure (figsize=(4,7))
ax = fig. gca ()

#create histogram using specified figure size
df[' points ']. hist ( grid= False , edgecolor=' black ', ax=ax)
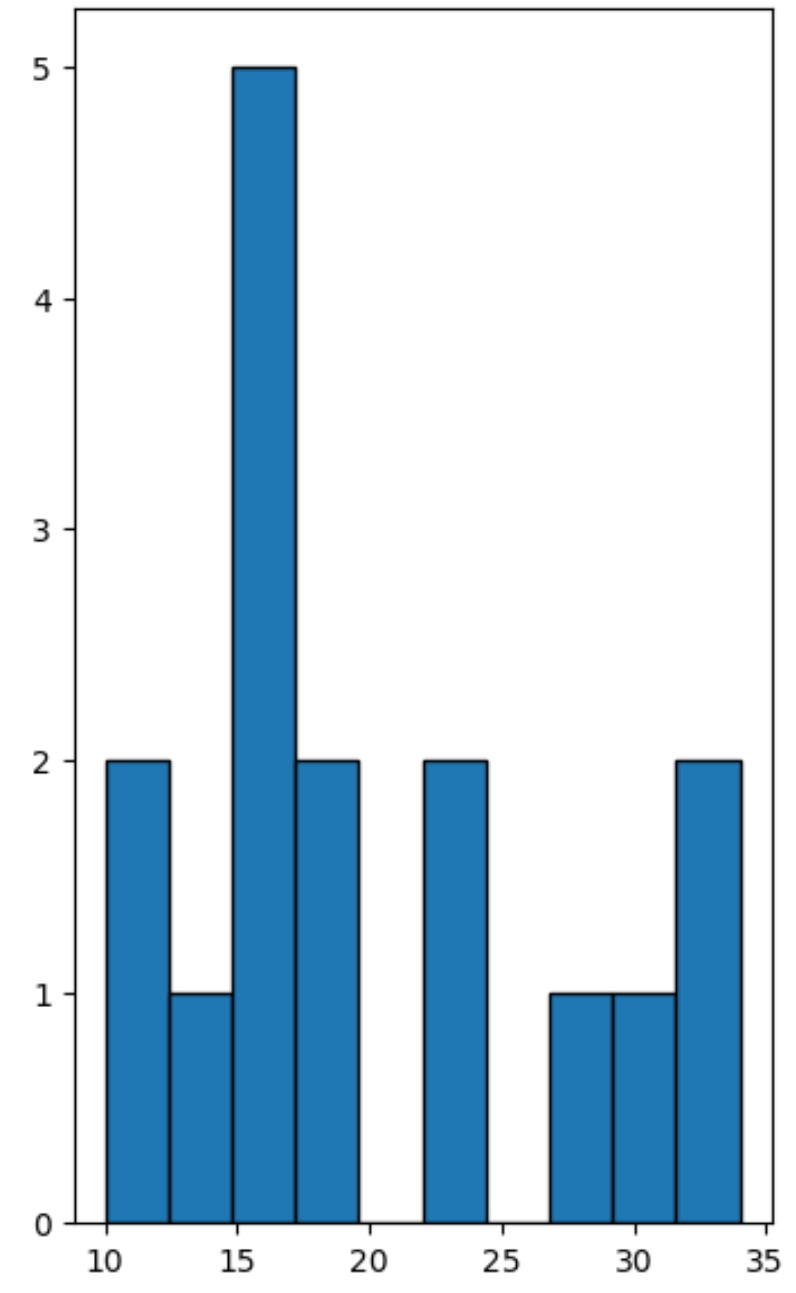
이 특정 히스토그램의 너비 는 4 이고 높이는 7 입니다.
원하는 정확한 크기의 히스토그램을 생성하려면 figsize 인수의 값을 자유롭게 사용해 보세요.
추가 리소스
다음 튜토리얼에서는 Pandas에서 다른 일반적인 작업을 수행하는 방법을 설명합니다.
Pandas DataFrame에서 히스토그램을 만드는 방법
Pandas 시리즈에서 히스토그램을 만드는 방법
Pandas에서 그룹별로 히스토그램을 그리는 방법
저자 소개
벤자민 앤더슨
안녕하세요. 저는 통계학 교수를 퇴직하고 전임 통계 교사로 변신한 벤자민입니다. 통계 분야의 광범위한 경험과 전문 지식을 바탕으로 Statorials를 통해 학생들에게 힘을 실어주기 위해 지식을 공유하고 싶습니다. 더 알아보기