R에서 플롯 외부에 범례를 그리는 방법
기본 R 플롯 외부에 범례를 그리는 가장 쉬운 방법은 다음 구문을 사용하여 플롯 오른쪽에 추가 공간을 추가하는 것입니다.
by( mar =c(5, 4, 4, 8), xpd= TRUE )
다음 단계별 예제에서는 이 구문을 실제로 사용하는 방법을 보여줍니다.
1단계: 데이터 생성
먼저 작업할 데이터를 만들어 보겠습니다.
 #create data frames
df1 <- data. frame (x=c(1, 2, 3, 4, 5, 6, 7),
                  y=c(2, 7, 19, 26, 24, 29, 31))

df2 <- data. frame (x=c(1, 2, 3, 4, 5, 6, 7),
                  y=c(4, 4, 7, 9, 12, 13, 8))
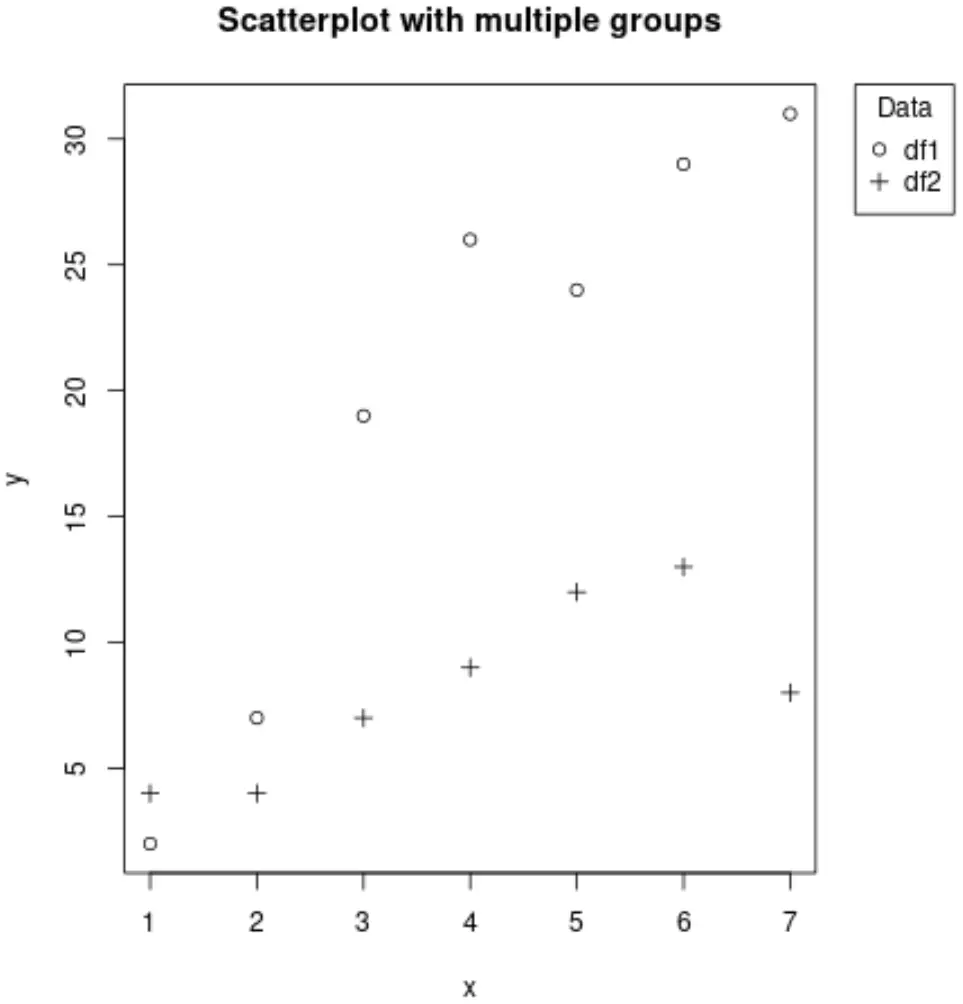
2단계: 플롯 외부에 범례가 있는 플롯 만들기
다음으로 경로를 만들고 오른쪽 상단 모서리에 있는 경로 외부에 범례를 추가해 보겠습니다.
 #add extra space to the right of the plot
by( mar =c(5, 4, 4, 8), xpd= TRUE )

#plot both data frames
plot(y ~ x, df1, pch =1, main=" Scatterplot with multiple groups ")
points(y ~ x, df2, pch =3)

#add legend outside of plot
legend(" topright ", inset =c(-0.2, 0), legend =c(" df1 "," df2 "), pch =c(1,3), title =" Data ")
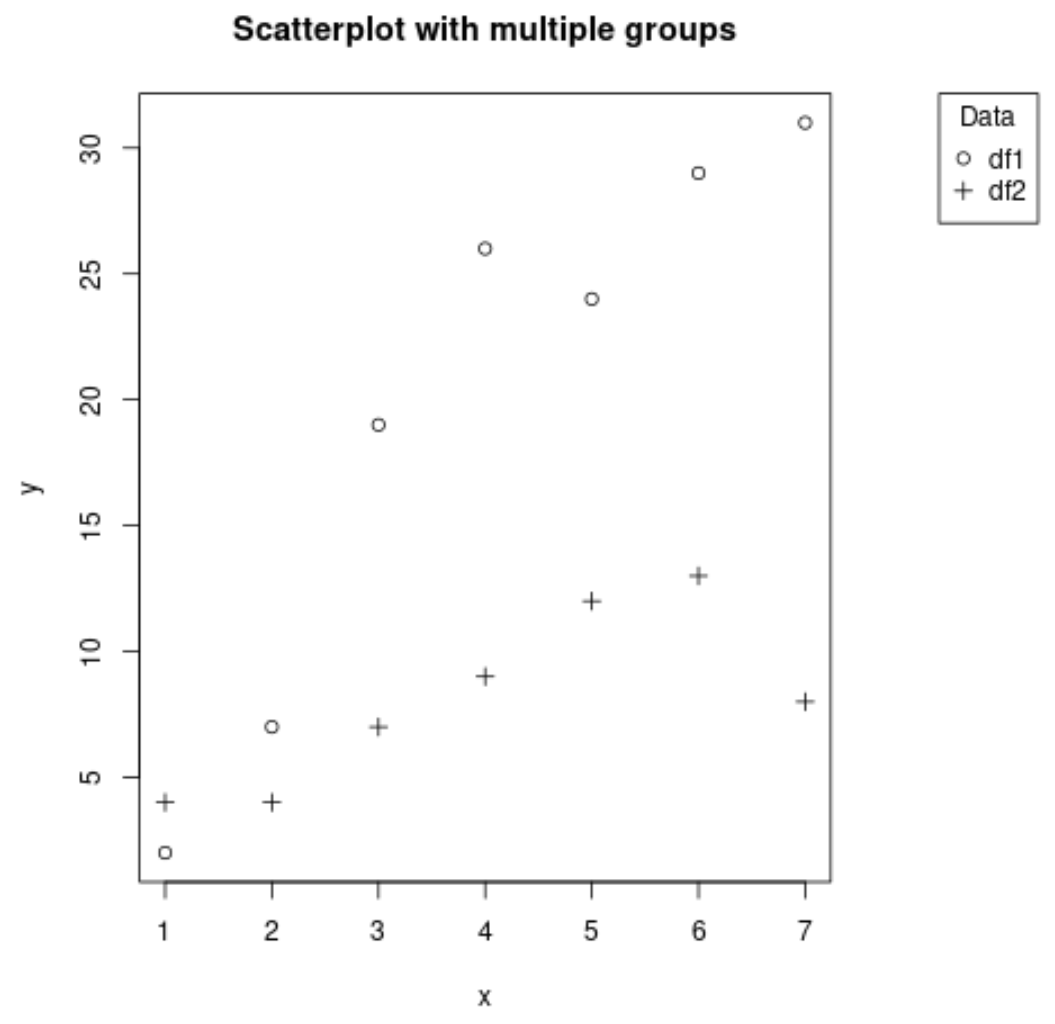
3단계: 범례 위치 변경
inset(x, y) 인수를 사용하여 플롯 오른쪽에 있는 범례의 위치를 제어할 수 있습니다. 예를 들어, 인수 x를 더 음수로 만들어 범례를 더욱 오른쪽으로 밀 수 있습니다.
 #add extra space to the right of the plot
by( mar =c(5, 4, 4, 8), xpd= TRUE )

#plot both data frames
plot(y ~ x, df1, pch =1, main=" Scatterplot with multiple groups ")
points(y ~ x, df2, pch =3)

#add legend outside of plot
legend(" topright ", inset =c(-0.3, 0), legend =c(" df1 "," df2 "), pch =c(1,3), title =" Data ")
범례를 더 낮추기 위해 y 인수를 더 긍정적으로 만들 수도 있습니다.
 #add extra space to the right of the plot
by( mar =c(5, 4, 4, 8), xpd= TRUE )

#plot both data frames
plot(y ~ x, df1, pch =1, main=" Scatterplot with multiple groups ")
points(y ~ x, df2, pch =3)

#add legend outside of plot
legend(" topright ", inset =c(-0.3, .5), legend =c(" df1 "," df2 "), pch =c(1,3), title =" Data ")
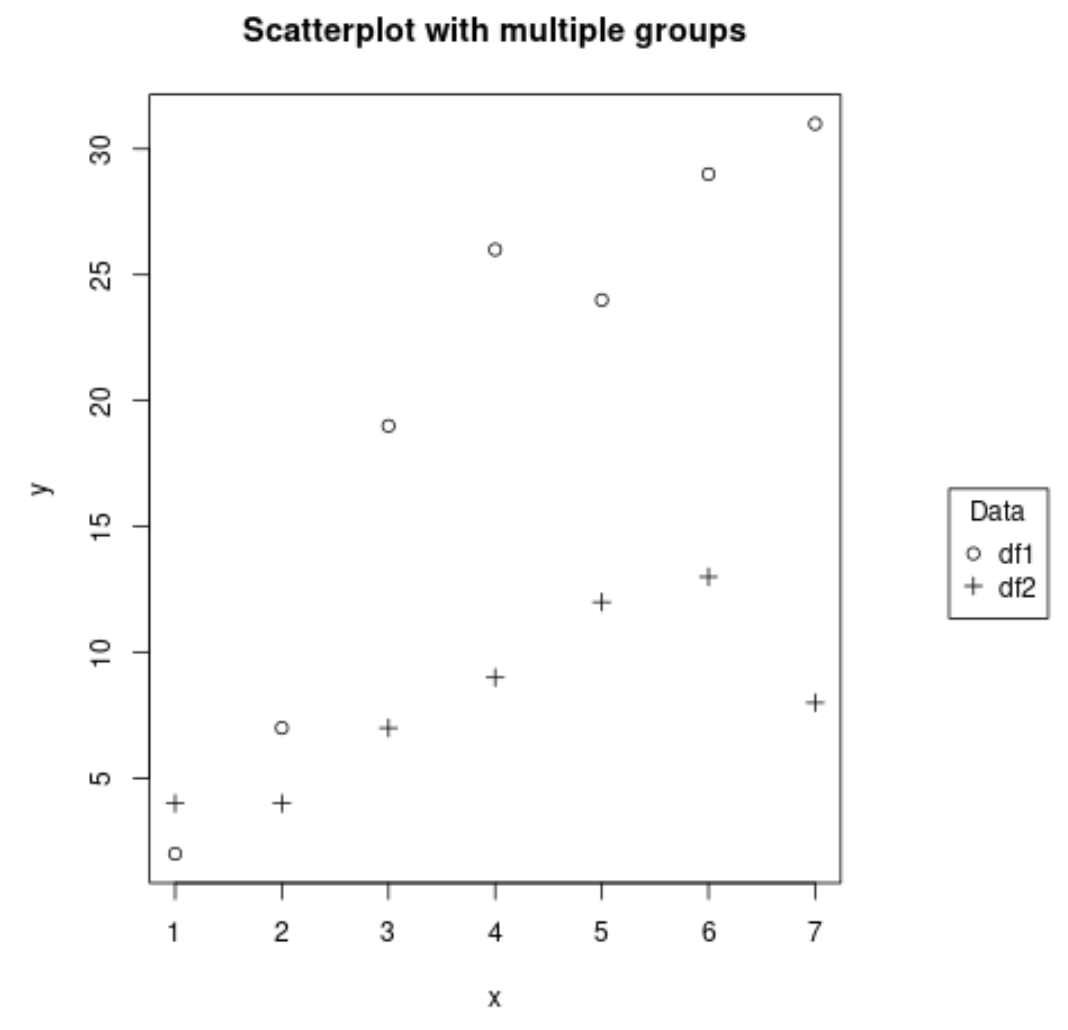
범례의 위치를 변경하려면 inset(x, y) 인수의 값을 자유롭게 수정하세요.
이 페이지 에서 더 많은 R 튜토리얼을 찾을 수 있습니다.
저자 소개
벤자민 앤더슨
안녕하세요. 저는 통계학 교수를 퇴직하고 전임 통계 교사로 변신한 벤자민입니다. 통계 분야의 광범위한 경험과 전문 지식을 바탕으로 Statorials를 통해 학생들에게 힘을 실어주기 위해 지식을 공유하고 싶습니다. 더 알아보기