Matplotlib တွင် ကွက်ကွက်အရွယ်အစားကို မည်သို့တိုးမည်နည်း။
Matplotlib ရှိ ကွက်ကွက်တစ်ခု၏ အရွယ်အစားကို တိုးမြှင့်ရန် အောက်ပါ syntax ကို သင်အသုံးပြုနိုင်သည်-
 import matplotlib. pyplot as plt

#define figure size in (width, height) for a single plot
plt. figure (figsize=(3,3))
မှတ်စုစာအုပ်တစ်ခုရှိ Matplotlib ကွက်များ အားလုံး၏ အရွယ်အစားကို တိုးမြှင့်ရန် အောက်ပါ syntax ကို သင်အသုံးပြုနိုင်သည်-
 import matplotlib. pyplot as plt

#define figure size in (width, height) for all plots
plt. rcParams [' figure.figsize '] = [10, 7]
အောက်ပါဥပမာများသည် ဤ syntax ကိုလက်တွေ့တွင်မည်သို့အသုံးပြုရမည်ကိုပြသထားသည်။
ဥပမာ 1- Matplotlib ကွက်ကွက်တစ်ခု၏ အရွယ်အစားကို တိုးပါ။
Matplotlib တွင် အောက်ပါမျဉ်းကြောင်းကွက်ကို ဖန်တီးသည်ဆိုပါစို့။
 import matplotlib. pyplot as plt

#define x and y
x = [1, 6, 10]
y = [5, 13, 27]

#create plot of x and y
plt. plot (x, y)
plt. show ()
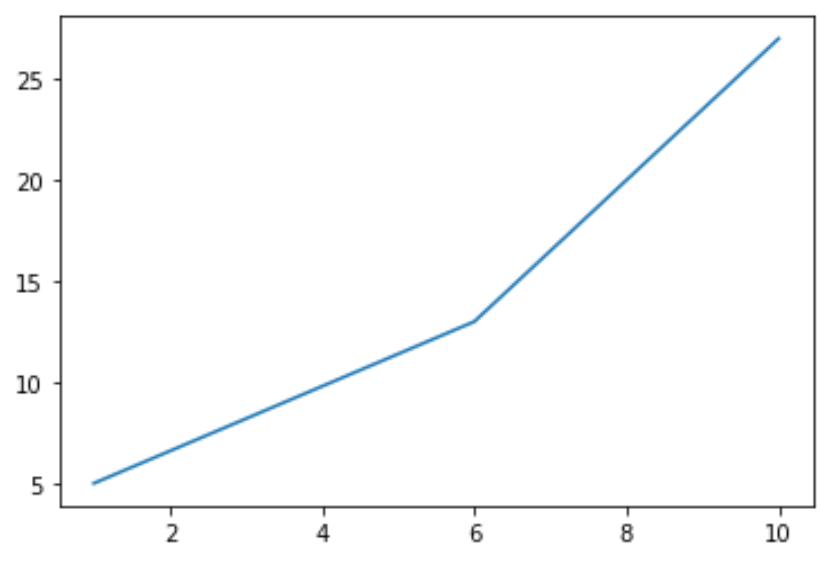
မူရင်းအားဖြင့်၊ Matplotlib ကွက်တစ်ခု၏ (အနံ၊ အမြင့်) သည် (၆.၄၊ ၄.၈) ဖြစ်သည်။
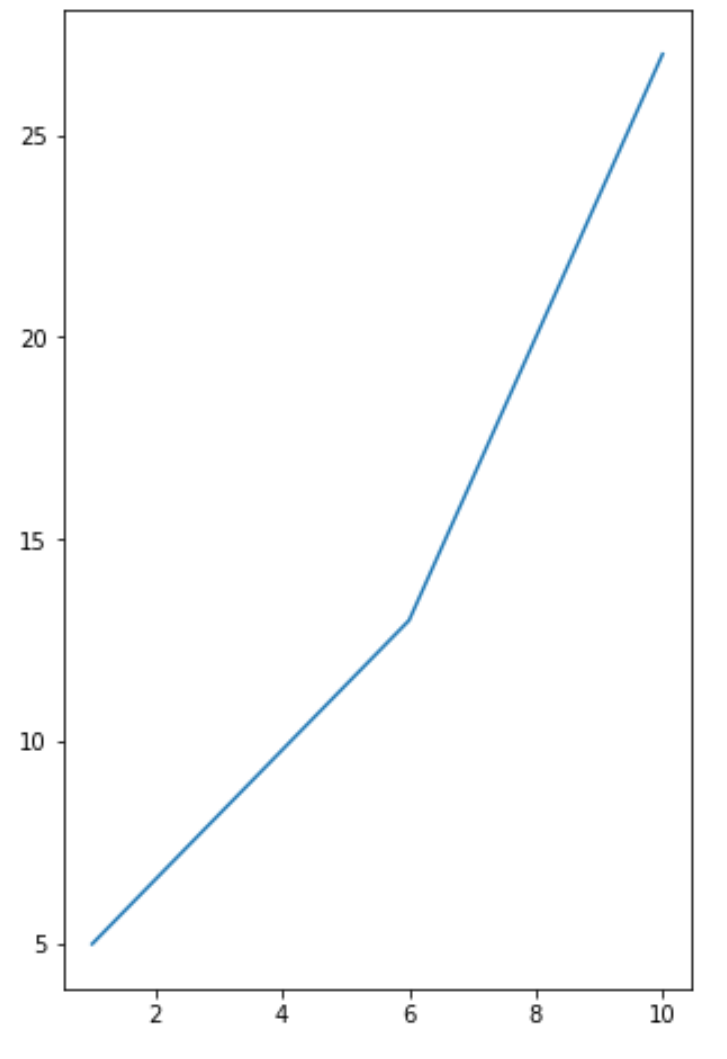
သို့သော်၊ ကျွန်ုပ်တို့သည် အလိုရှိသောအတိုင်းအတာများအထိ ကွက်ကွက်၏အရွယ်အစားကို တိုးမြှင့်ရန် အောက်ပါ syntax ကို အသုံးပြုနိုင်ပါသည်။
 import matplotlib. pyplot as plt

#define plot size
plt. figure (figsize=(5,8))

#define x and y
x = [1, 6, 10]
y = [5, 13, 27]

#create plot of x and y
plt. plot (x, y)
plt. show ()
ဥပမာ 2- Matplotlib ကွက်များအားလုံး၏ အရွယ်အစားကို တိုးပါ။
အောက်ဖော်ပြပါကုဒ်သည် မှတ်စုစာအုပ်ရှိ Matplotlib ကွက် များအားလုံးအတွက် ကွက်ကွက်အရွယ်အစားကို မည်သို့သတ်မှတ်ရမည်ကို ပြသသည်-
 import matplotlib. pyplot as plt

#define plot size for all plots
plt. rcParams [' figure.figsize '] = [10, 4]

#define first dataset
x = [1, 6, 10]
y = [5, 13, 27]

#create first plot
plt. plot (x, y)
plt. show ()

#define second dataset
x2 = [1, 6, 10]
y2 = [5, 19, 12]

#create second plot
plt. plot (x2, y2)
plt. show ()
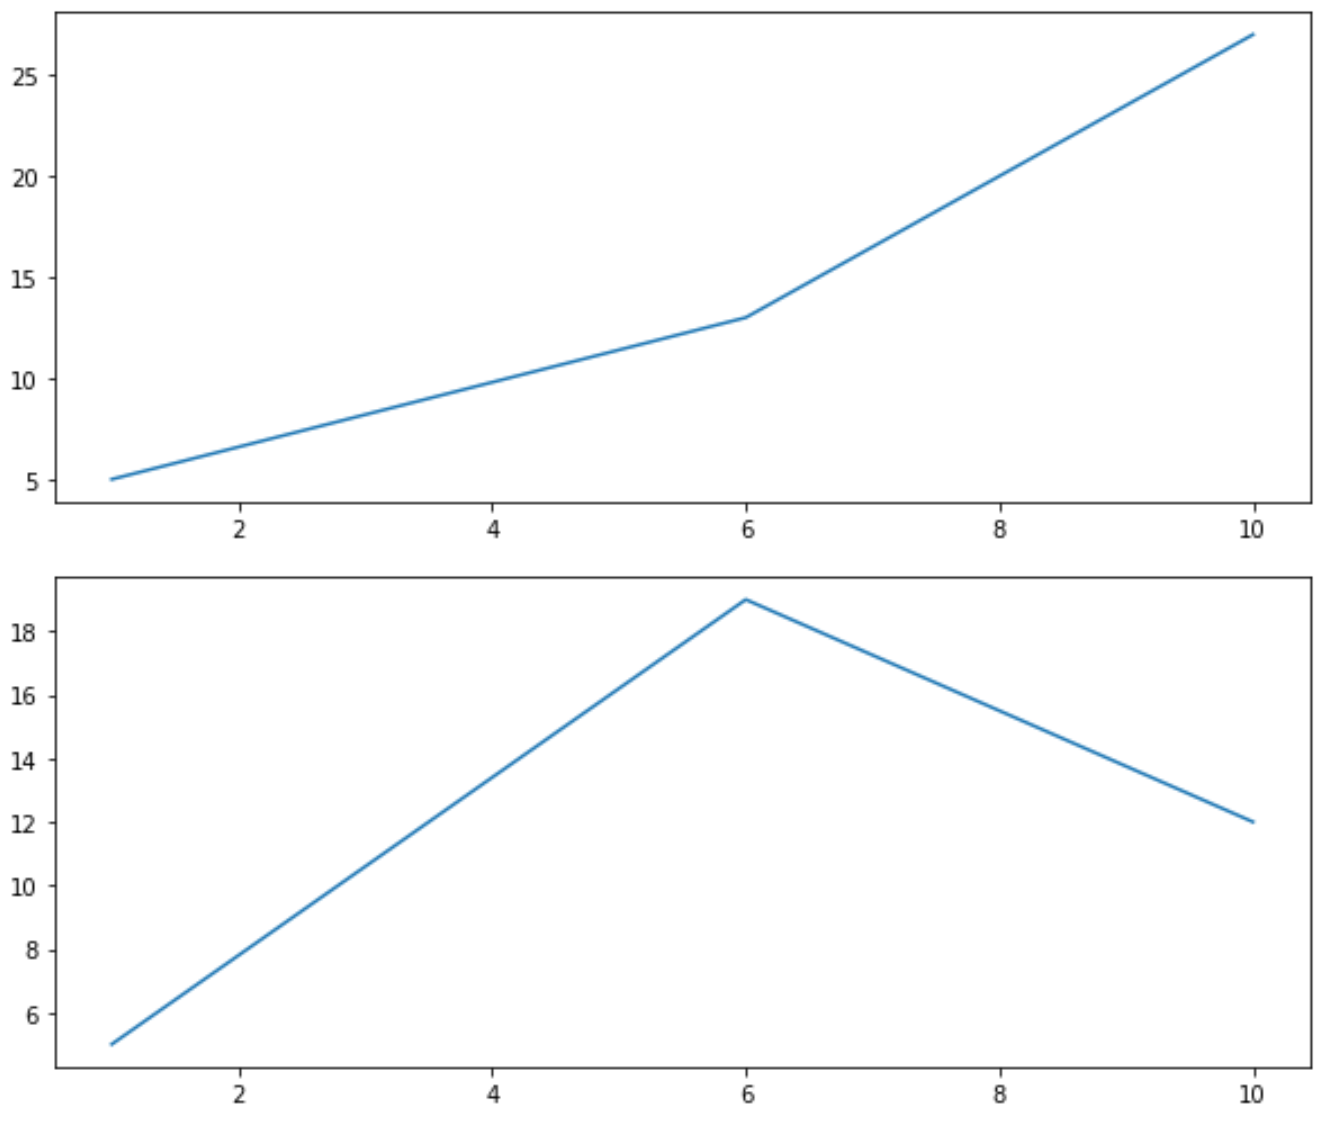
ကွက်နှစ်ခုစလုံးတွင် rcParams အကြောင်းပြချက်များဖြင့် သတ်မှတ်ထားသော အကျယ်နှင့် အမြင့်ရှိသည်ကို သတိပြုပါ။
ထပ်လောင်းအရင်းအမြစ်များ
Matplotlib တွင် အမှတ်အသားအရွယ်အစားကို ချိန်ညှိနည်း
Matplotlib တွင် ဖောင့်အရွယ်အစားကို မည်သို့ပြောင်းလဲမည်နည်း။
Matplotlib တွင် မျဉ်းအထူကို ချိန်ညှိနည်း
စာရေးသူအကြောင်း
Benjamin Anderson
မင်္ဂလာပါ၊ ကျွန်ုပ်သည် အငြိမ်းစား စာရင်းအင်း ပါမောက္ခ ဘင်ဂျမင်ဖြစ်ပြီး သီးသန့် Statorials ဆရာအဖြစ် လှည့်ပတ်ပါသည်။ စာရင်းဇယားနယ်ပယ်တွင် ကျယ်ပြန့်သောအတွေ့အကြုံနှင့် ကျွမ်းကျင်မှုနှင့်အတူ၊ Statorials မှတစ်ဆင့် ကျောင်းသားများကို ခွန်အားဖြစ်စေရန်အတွက် ကျွန်ုပ်၏အသိပညာကို မျှဝေလိုပါသည်။ ပိုသိတယ်။