Matplotlib တွင် fig.add_subplot ကိုအသုံးပြုနည်း
Matplotlib တွင် subplot များဖန်တီးရန် အောက်ပါအခြေခံ syntax ကို သင်အသုံးပြုနိုင်ပါသည်။
 import matplotlib. pyplot as plt

#define figure
fig = plt. figure ()

#add first subplot in layout that has 3 rows and 2 columns
fig. add_subplot (321)

#add fifth subplot in layout that has 3 rows and 2 columns
fig. add_subplot (325)

...
အောက်ပါဥပမာများသည် ဤ syntax ကိုလက်တွေ့တွင်မည်သို့အသုံးပြုရမည်ကိုပြသထားသည်။
ဥပမာ 1- ယူနီဖောင်း အပြင်အဆင်ဖြင့် အပိုင်းခွဲများကို ထည့်ပါ။
အောက်ပါကုဒ်သည် အတန်းခွဲ 3 တန်းနှင့် ကော်လံ 2 ခုပါသည့် အပြင်အဆင်တွင် အပိုင်းခြောက်ခုကို ဖန်တီးနည်းကို ပြသသည်-
 import matplotlib. pyplot as plt

#define figure
fig = plt. figure ()

#add subplots
fig. add_subplot (321). set_title (' 321 ')
fig. add_subplot (322). set_title (' 322 ')
fig. add_subplot (323). set_title (' 323 ')
fig. add_subplot (324). set_title (' 324 ')
fig. add_subplot (325). set_title (' 325 ')
fig. add_subplot (326). set_title (' 326 ')

#display plots
plt. show ()
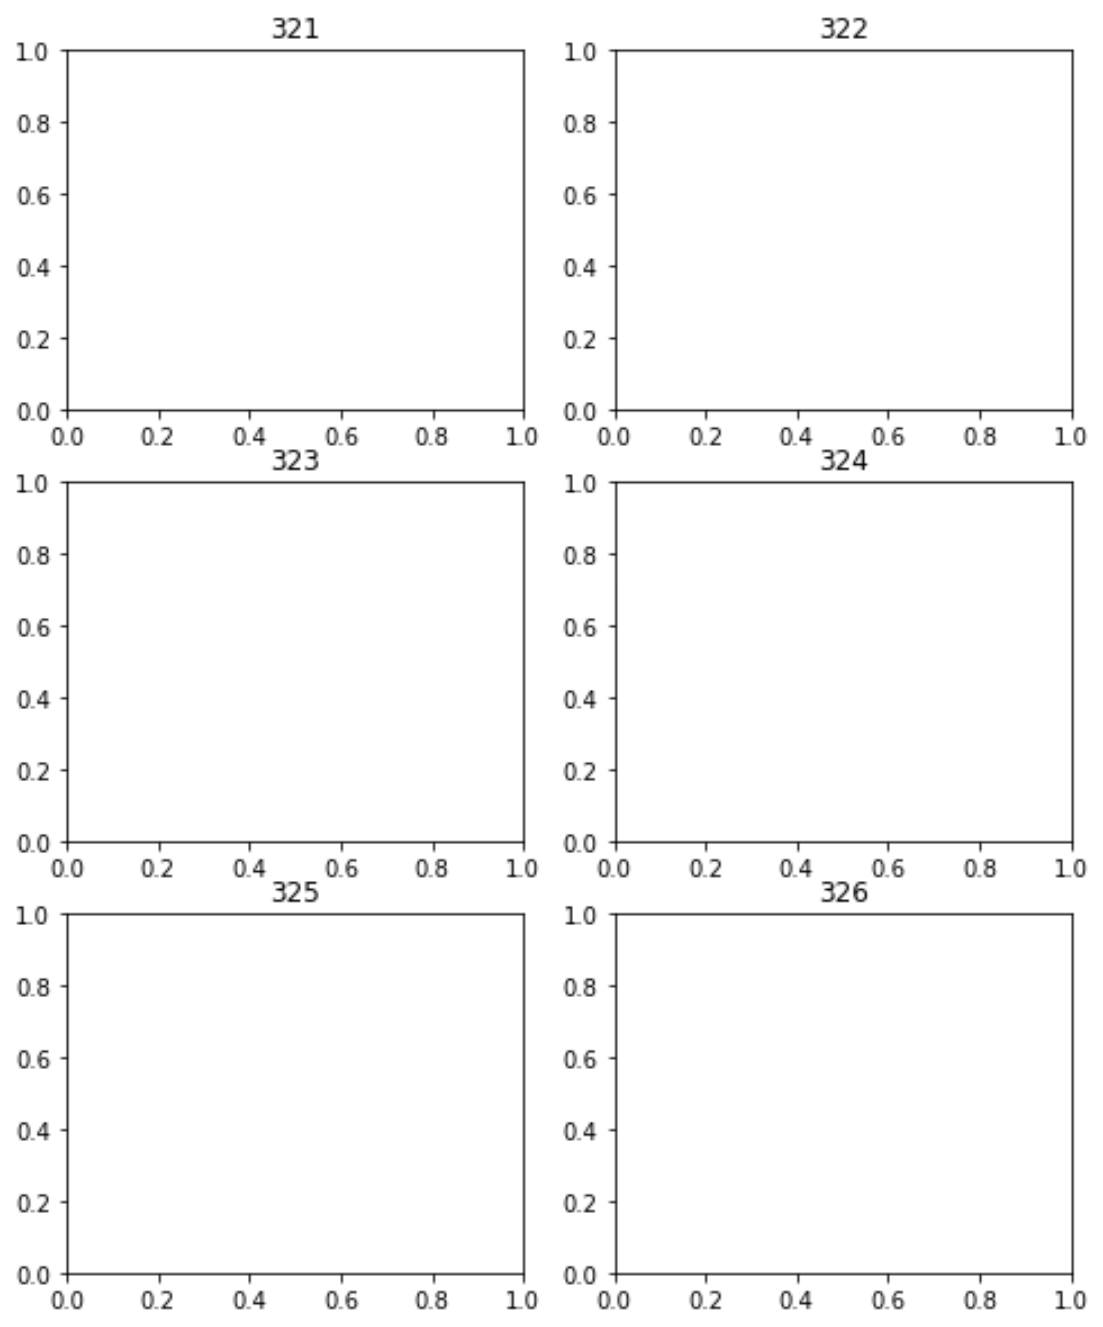
ရလဒ်မှာ အတန်းခွဲ 3 တန်းနှင့် ကော်လံ 2 ခုပါသည့် အပြင်အဆင်တွင် ပြသထားသည့် အပိုင်းခြောက်ခုဖြစ်ကြောင်း သတိပြုပါ။
ဥပမာ 2- မညီညာသော အပြင်အဆင်ဖြင့် အပိုင်းခွဲများကို ထည့်ပါ။
အောက်ပါကုဒ်သည် အပိုင်းခွဲလေးခုကို ဖန်တီးနည်းကို အောက်ပါအတိုင်း ပြသသည်
- ကွက်သုံးခုကို ၃ တန်းနှင့် ကော်လံ ၂ ခုဖြင့် ဇယားကွက်ဖြင့် ဖန်တီးထားသည်။
- စတုတ္ထကွက်ကွက်ကို 1 အတန်းနှင့် ကော်လံ 2 ခုပါသော ဇယားကွက်တွင် ဖန်တီးထားသည်။
 import matplotlib. pyplot as plt

#define figure
fig = plt. figure ()

#add subplots
fig. add_subplot (321). set_title (' 321 ')
fig. add_subplot (323). set_title (' 323 ')
fig. add_subplot (325). set_title (' 325 ')
fig. add_subplot (122). set_title (' 122 ')

#display plots
plt. show ()
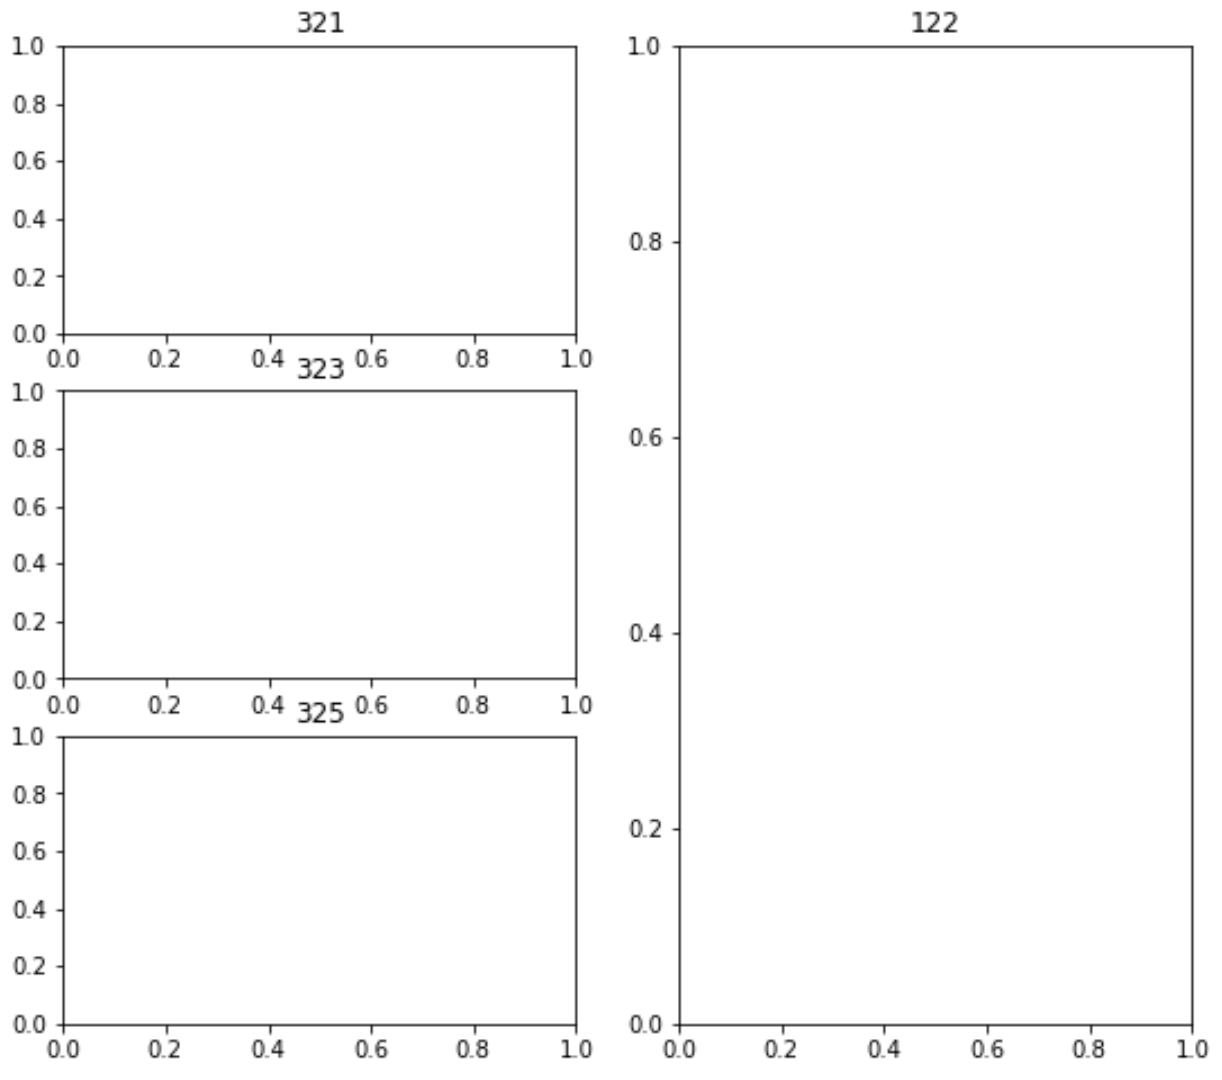
နောက်ဆုံးရလဒ်မှာ 3×2 ဂရစ်တွင် ပြသထားသည့် အပိုင်းခွဲသုံးခုဖြစ်ပြီး နောက်ဆုံးအပိုင်းခွဲကို 1×2 ဇယားကွက်တွင် ပြသထားသည်။
ထပ်လောင်းအရင်းအမြစ်များ
အောက်ဖော်ပြပါ သင်ခန်းစာများသည် Matplotlib ရှိ အခြားသော ဘုံလုပ်ဆောင်ချက်များကို မည်သို့လုပ်ဆောင်ရမည်ကို ရှင်းပြသည်-
Matplotlib အပိုင်းခွဲများကြား အကွာအဝေးကို ချိန်ညှိနည်း
Matplotlib ရှိ subplot အရွယ်အစားကို ချိန်ညှိနည်း
Matplotlib ရှိ subplot များတွင် ခေါင်းစဉ်တစ်ခုထည့်နည်း
စာရေးသူအကြောင်း
Benjamin Anderson
မင်္ဂလာပါ၊ ကျွန်ုပ်သည် အငြိမ်းစား စာရင်းအင်း ပါမောက္ခ ဘင်ဂျမင်ဖြစ်ပြီး သီးသန့် Statorials ဆရာအဖြစ် လှည့်ပတ်ပါသည်။ စာရင်းဇယားနယ်ပယ်တွင် ကျယ်ပြန့်သောအတွေ့အကြုံနှင့် ကျွမ်းကျင်မှုနှင့်အတူ၊ Statorials မှတစ်ဆင့် ကျောင်းသားများကို ခွန်အားဖြစ်စေရန်အတွက် ကျွန်ုပ်၏အသိပညာကို မျှဝေလိုပါသည်။ ပိုသိတယ်။