Seaborn ရှိ point cloud သို့ လိုင်းတစ်ခုထည့်နည်း
Seaborn ရှိ point cloud သို့ လိုင်းတစ်ခုထည့်ရန် အောက်ပါနည်းလမ်းများကို သင်အသုံးပြုနိုင်သည်-
နည်းလမ်း 1- အလျားလိုက်မျဉ်းတစ်ခုထည့်ပါ။
 #add horizontal line at y=15
plt. axhline (y=15)
နည်းလမ်း 2- ဒေါင်လိုက်မျဉ်းတစ်ခုထည့်ပါ။
 #add vertical line at x=4
plt. axvline (x=4)
နည်းလမ်း 3- စိတ်ကြိုက်အတန်းတစ်ခုထည့်ပါ။
 #add straight line that extends from (x,y) coordinates (2,0) to (6, 25)
plt. plot ([2, 6], [0, 25])
အောက်ဖော်ပြပါ ဥပမာများသည် နည်းလမ်းတစ်ခုစီကို လက်တွေ့အသုံးချနည်းကို ပြသထားသည်။
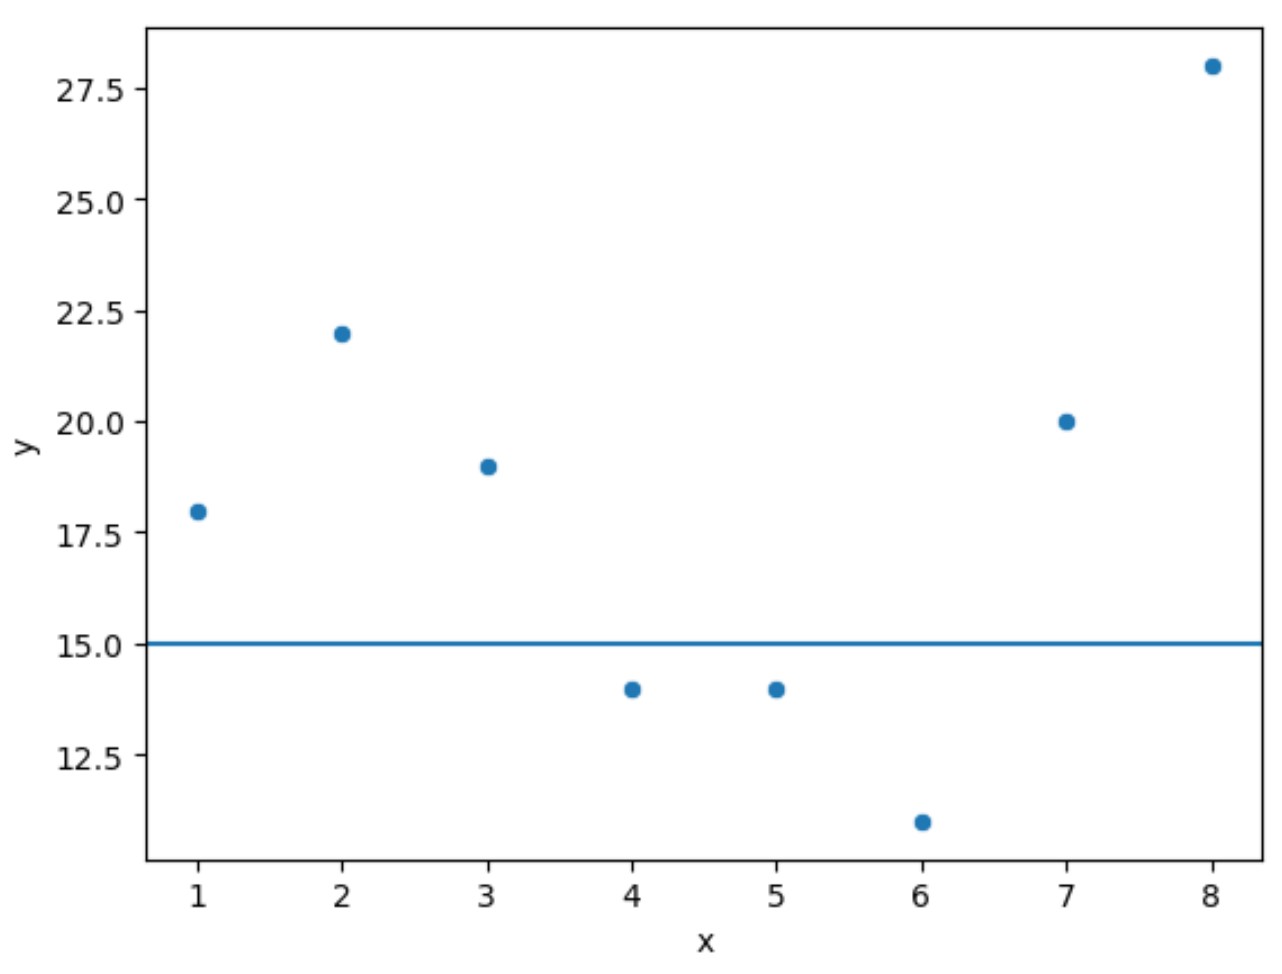
ဥပမာ 1- Seaborn point cloud တွင် အလျားလိုက်မျဉ်းတစ်ခုကို ထည့်ပါ။
အောက်ဖော်ပြပါ ကုဒ်သည် Seaborn တွင် ခွဲခြမ်းစိပ်ဖြာပုံ ဖန်တီးနည်းကို ပြသပြီး y = 15 တွင် အလျားလိုက် မျဉ်းကို ပေါင်းထည့်သည် ။
 import seaborn as sns
import matplotlib. pyplot as plt

#createDataFrame
df = pd. DataFrame ({' x ': [1, 2, 3, 4, 5, 6, 7, 8],
                   ' y ': [18, 22, 19, 14, 14, 11, 20, 28]})

#create scatterplot
sns. scatterplot (x= df.x , y= df.y )

#add horizontal line to scatterplot
plt. axhlin (y=15)
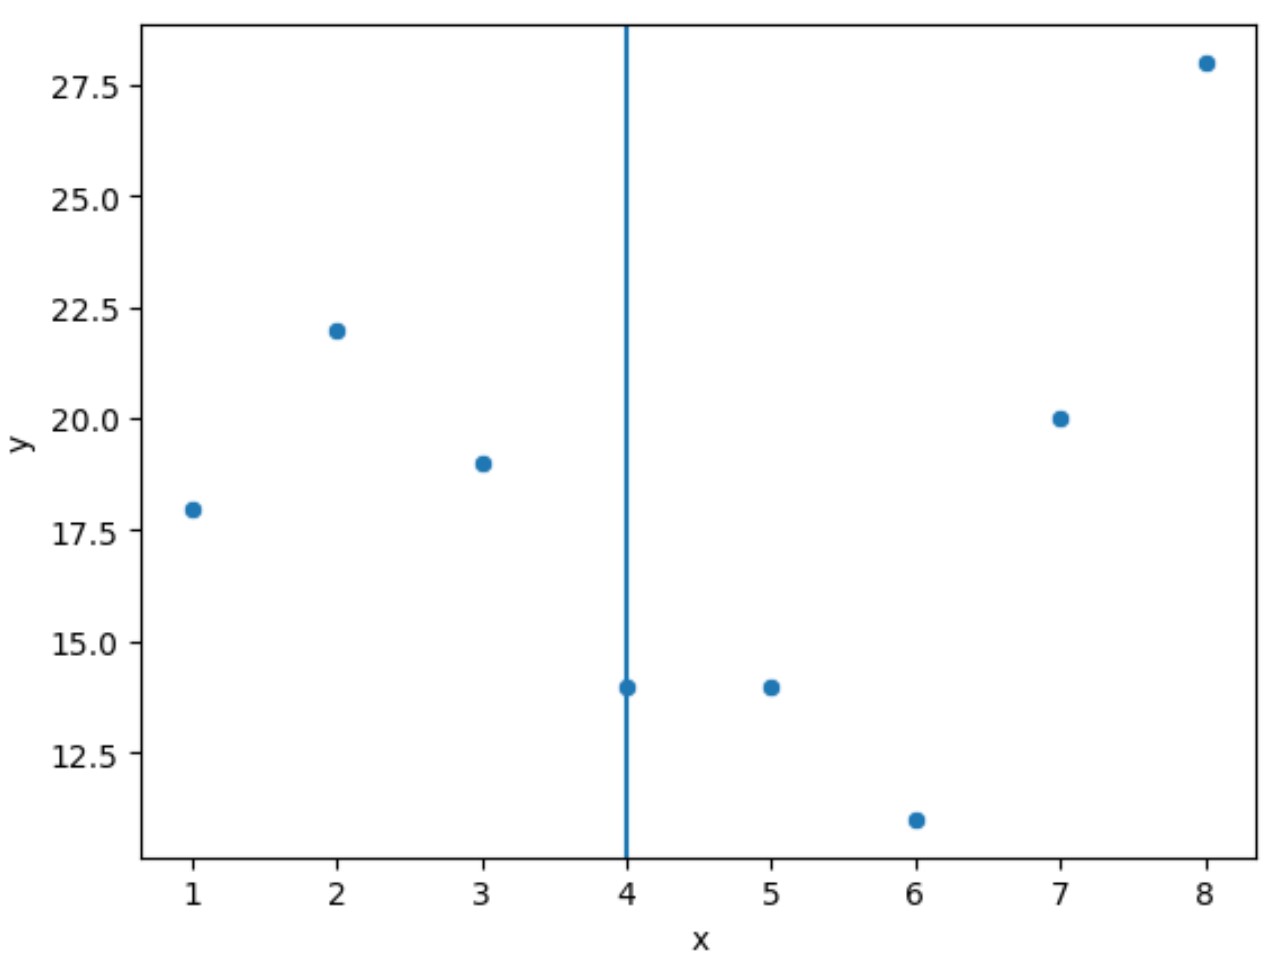
ဥပမာ 2- Seaborn point cloud တွင် ဒေါင်လိုက်မျဉ်းတစ်ခုကို ထည့်ပါ။
အောက်ဖော်ပြပါ ကုဒ်သည် Seaborn တွင် ခွဲခြမ်းစိပ်ဖြာပုံ ဖန်တီးနည်းကို ပြသပြီး x = 4 တွင် ဒေါင်လိုက်မျဉ်းကို ပေါင်းထည့်သည် ။
 import seaborn as sns
import matplotlib. pyplot as plt

#createDataFrame
df = pd. DataFrame ({' x ': [1, 2, 3, 4, 5, 6, 7, 8],
                   ' y ': [18, 22, 19, 14, 14, 11, 20, 28]})

#create scatterplot
sns. scatterplot (x= df.x , y= df.y )

#add vertical line to scatterplot
plt. axvline (x=4)
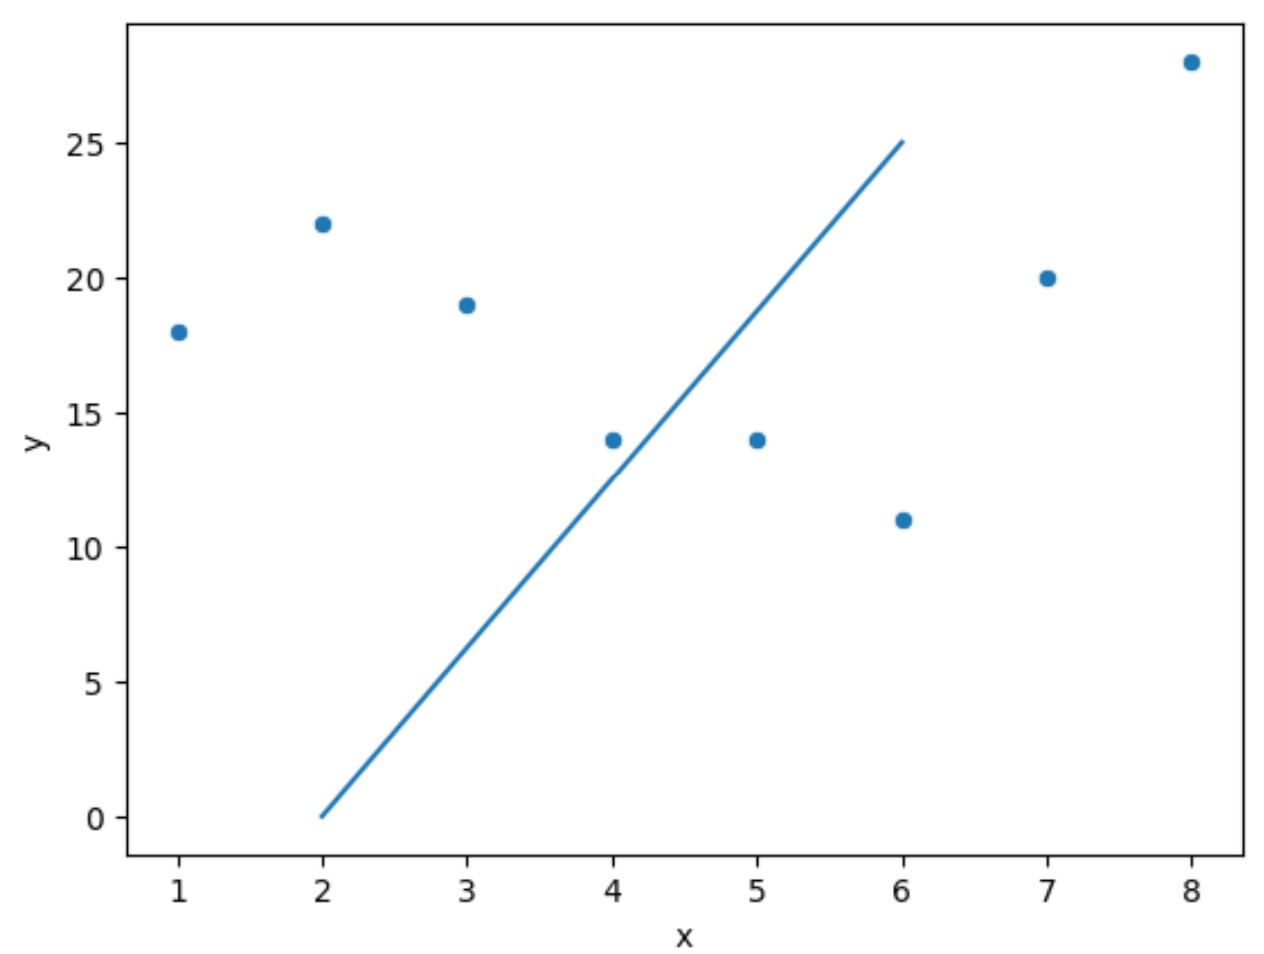
ဥပမာ 3 : Seaborn point cloud တွင် စိတ်ကြိုက်လိုင်းတစ်ခုကို ထည့်ပါ။
အောက်ဖော်ပြပါကုဒ်သည် Seaborn တွင် point cloud တစ်ခုဖန်တီးနည်းကိုပြသပြီး (x, y) သြဒိနိတ်များ (2,0) မှ (6, 25) အထိ မျဉ်းဖြောင့်တစ်ခုကို ပေါင်းထည့်သည်။
 import seaborn as sns
import matplotlib. pyplot as plt

#createDataFrame
df = pd. DataFrame ({' x ': [1, 2, 3, 4, 5, 6, 7, 8],
                   ' y ': [18, 22, 19, 14, 14, 11, 20, 28]})

#create scatterplot
sns. scatterplot (x= df.x , y= df.y )

#add custom line to scatterplot
plt. plot ([2, 6], [0, 25])
မှတ်ချက် – seaborn scatter() လုပ်ဆောင်ချက်အတွက် စာရွက်စာတမ်းအပြည့်အစုံကို ဤနေရာတွင် ရှာဖွေနိုင်ပါသည်။
ထပ်လောင်းအရင်းအမြစ်များ
အောက်ဖော်ပြပါ သင်ခန်းစာများသည် seaborn ကို အသုံးပြု၍ အခြားသော အလုပ်များကို မည်သို့လုပ်ဆောင်ရမည်ကို ရှင်းပြသည်-
Seaborn Plots တွင် ခေါင်းစဉ်တစ်ခုထည့်နည်း
Seaborn ကွက်များတွင် ဖောင့်အရွယ်အစားကို မည်သို့ပြောင်းရမည်နည်း။
Seaborn မြေကွက်များတွင် မှင်အရေအတွက်ကို ချိန်ညှိနည်း
စာရေးသူအကြောင်း
Benjamin Anderson
မင်္ဂလာပါ၊ ကျွန်ုပ်သည် အငြိမ်းစား စာရင်းအင်း ပါမောက္ခ ဘင်ဂျမင်ဖြစ်ပြီး သီးသန့် Statorials ဆရာအဖြစ် လှည့်ပတ်ပါသည်။ စာရင်းဇယားနယ်ပယ်တွင် ကျယ်ပြန့်သောအတွေ့အကြုံနှင့် ကျွမ်းကျင်မှုနှင့်အတူ၊ Statorials မှတစ်ဆင့် ကျောင်းသားများကို ခွန်အားဖြစ်စေရန်အတွက် ကျွန်ုပ်၏အသိပညာကို မျှဝေလိုပါသည်။ ပိုသိတယ်။