Seaborn- ဟီစတိုဂရမ်များတွင် အသွေးအရောင် ကန့်သတ်ချက်ကို မည်သို့အသုံးပြုရမည်နည်း။
သတ်မှတ်ထားသော ကိန်းရှင်၏တန်ဖိုးအပေါ်အခြေခံ၍ ဟီစတိုဂရမ်ဘားများကို အရောင်ခြယ်ရန်အတွက် Seaborn တွင် ရောင်စုံပါ ရာမီတာကို အသုံးပြုနိုင်သည်။
ဒါကိုလုပ်ဖို့၊ အောက်ပါအခြေခံ syntax ကိုသုံးနိုင်ပါတယ်။
 import seaborn as sns

sns. histplot (data=df, x=' points ', hue=' team ')
ဤထူးခြားသောဥပမာသည် အသင်း ပြောင်းလဲနိုင်သောတန်ဖိုးအပေါ်အခြေခံ၍ ဘားများကိုအရောင်ခြယ်ထားသည့် variable point များအတွက် histogram တစ်ခုဖန်တီးပေးသည်။
အောက်ဖော်ပြပါ ဥပမာသည် ဤ syntax ကို လက်တွေ့တွင် မည်သို့အသုံးပြုရမည်ကို ပြသထားသည်။
ဥပမာ- Seaborn Histogram တွင် Hue Parameter ကို အသုံးပြုခြင်း။
ကျွန်ုပ်တို့တွင် မတူညီသောအသင်းနှစ်သင်းမှ ဘတ်စကက်ဘောကစားသမားများမှ ရမှတ်များကိုပြသသည့် အောက်ပါပန်ဒါ DataFrame ရှိသည်ဆိုပါစို့။
 import pandas as pd
import numpy as np

#make this example reproducible
n.p. random . seeds (1)

#createDataFrame
df = pd. DataFrame ({' team ':np. repeat (['A', 'B'], 100),
                   ' points ': np. concatenate ([
                       n.p. random . normal (size=100,loc=15,scale=2),
                       n.p. random . normal (size=100, loc=25, scale=4)])})

#view head of DataFrame
print ( df.head ())

  team points
0 A 18.248691
1 A 13.776487
2 A 13.943656
3 A 12.854063
4 A 16.730815
team variable ဖြင့် အုပ်စုဖွဲ့ထားသော point variable ၏ histograms များကို ဖန်တီးရန် seaborn histplot() function ကို အသွေးအရောင် ကန့်သတ်ချက်ဖြင့် အသုံးပြုနိုင်သည်။
 import seaborn as sns

#create histogram to visualize distribution of points by team
sns. histplot (data=df, x=' points ', hue=' team ')
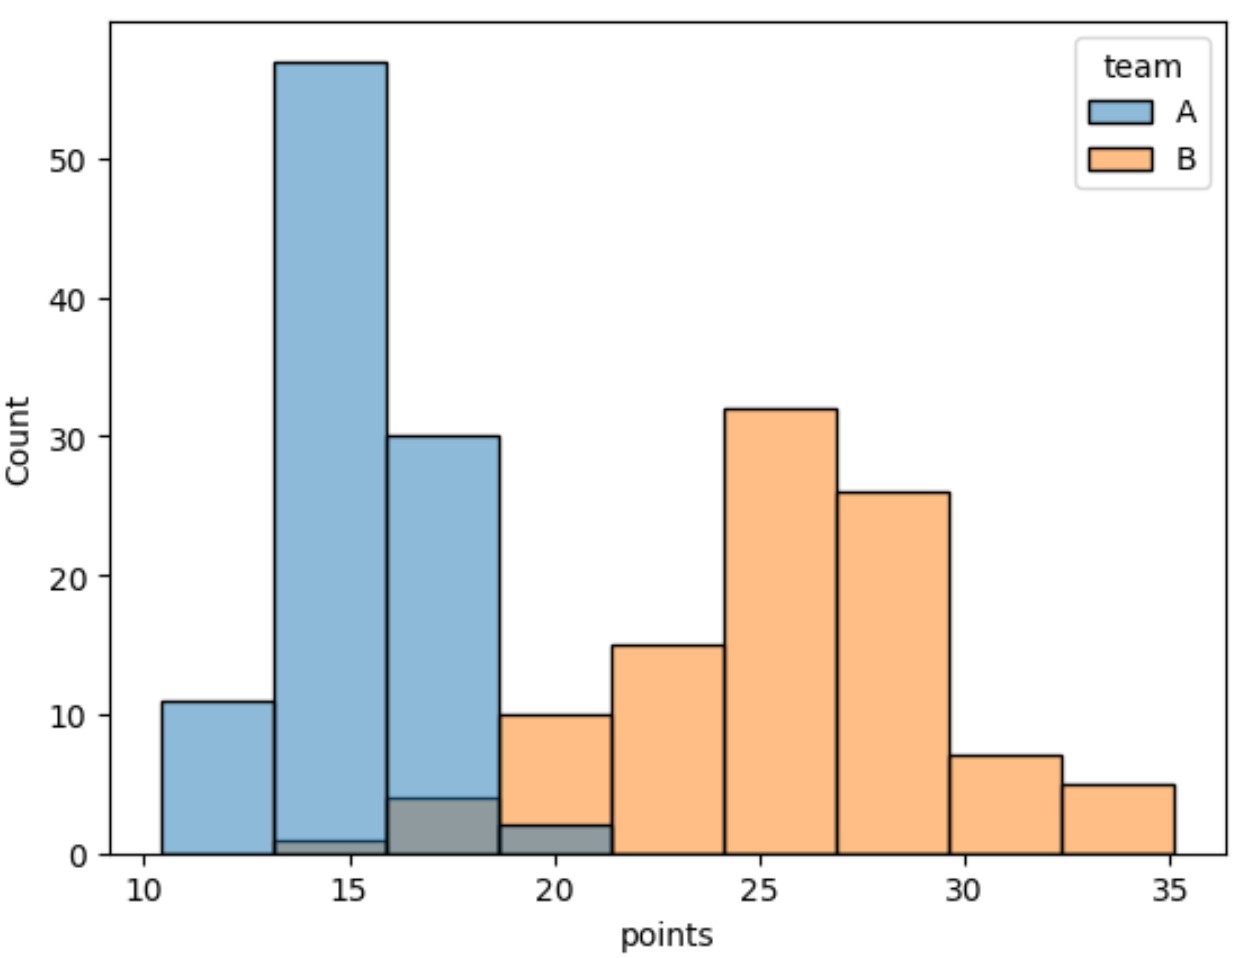
ရလဒ်ထွက်ကွက်တွင် အဖွဲ့ကော်လံတန်ဖိုးများအပေါ် အခြေခံထားသော အရောင်များ ထပ်ဆင့်ထားသော ဟစ်စတိုဂရမ်များ ပါရှိသည်။
Histogram တွင် အသုံးပြုရမည့်အရောင်များကို သတ်မှတ်ရန် palette argument ကိုလည်း အသုံးပြုနိုင်ကြောင်း သတိပြုပါ။
 import seaborn as sns

#create histogram to visualize distribution of points by team
sns. histplot (data=df, x=' points ', hue=' team ', palette=[' lightgreen ', ' pink '])
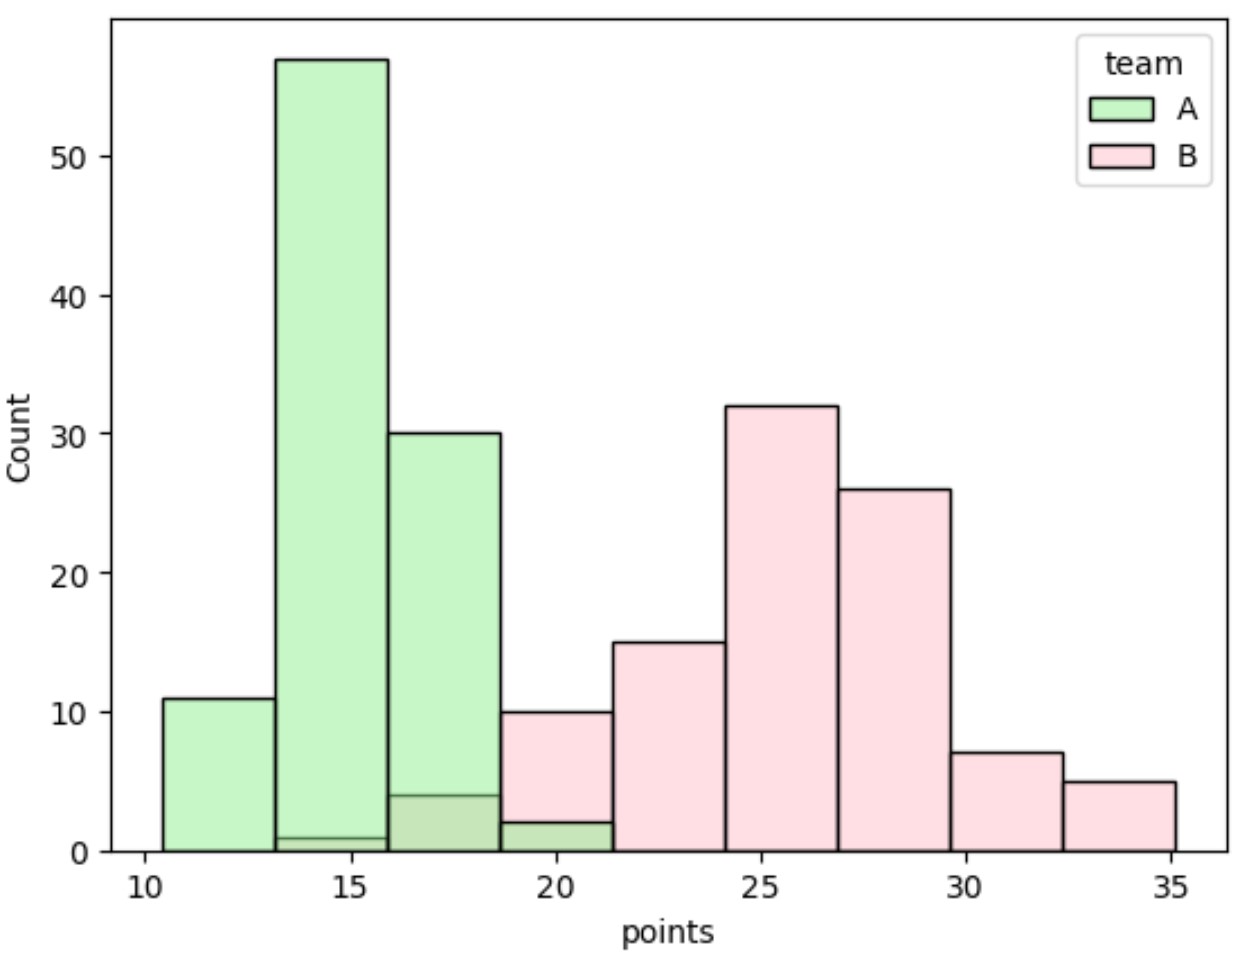
histplot() လုပ်ဆောင်ချက်ရှိ palette အငြင်းအခုံကိုအသုံးပြု၍ ကျွန်ုပ်တို့သတ်မှတ်ထားသည့်အတိုင်း ယခုအခါ အစိမ်းရောင်နှင့် ပန်းရောင်ကို အရောင်များအဖြစ် အသုံးပြုထားသည်။
မှတ်ချက် – seaborn histplot() လုပ်ဆောင်ချက်အတွက် စာရွက်စာတမ်းအပြည့်အစုံကိုဤနေရာတွင် ရှာဖွေနိုင်ပါသည်။
ထပ်လောင်းအရင်းအမြစ်များ
အောက်ဖော်ပြပါ သင်ခန်းစာများသည် seaborn ကို အသုံးပြု၍ အခြားသော အလုပ်များကို မည်သို့လုပ်ဆောင်ရမည်ကို ရှင်းပြသည်-
Seaborn Plots တွင် ခေါင်းစဉ်တစ်ခုထည့်နည်း
Seaborn ကွက်များတွင် ဖောင့်အရွယ်အစားကို မည်သို့ပြောင်းရမည်နည်း။
Seaborn မြေကွက်များတွင် မှင်အရေအတွက်ကို ချိန်ညှိနည်း
စာရေးသူအကြောင်း
Benjamin Anderson
မင်္ဂလာပါ၊ ကျွန်ုပ်သည် အငြိမ်းစား စာရင်းအင်း ပါမောက္ခ ဘင်ဂျမင်ဖြစ်ပြီး သီးသန့် Statorials ဆရာအဖြစ် လှည့်ပတ်ပါသည်။ စာရင်းဇယားနယ်ပယ်တွင် ကျယ်ပြန့်သောအတွေ့အကြုံနှင့် ကျွမ်းကျင်မှုနှင့်အတူ၊ Statorials မှတစ်ဆင့် ကျောင်းသားများကို ခွန်အားဖြစ်စေရန်အတွက် ကျွန်ုပ်၏အသိပညာကို မျှဝေလိုပါသည်။ ပိုသိတယ်။