Ggplot2 တွင် မျဉ်းဖြောင့်များထည့်ရန် geom_abline ကိုအသုံးပြုနည်း
ggplot2 ရှိ ကွက်များသို့ မျဉ်းဖြောင့်များထည့်ရန် geom_abline() လုပ်ဆောင်ချက်နှင့် အခြားသော အလားတူ geom လုပ်ဆောင်ချက်များကို သင်အသုံးပြုနိုင်ပါသည်။
ဤလုပ်ဆောင်ချက်များကို အသုံးပြုရန် အသုံးအများဆုံးနည်းလမ်းများမှာ-
နည်းလမ်း 1- ကုန်းစောင်းနှင့် လမ်းဆုံများပါရှိသော မျဉ်းကြောင်းတစ်ခုထည့်ရန် geom_abline() ကိုသုံးပါ။
 ggplot(df, aes(x, y)) +
  geom_point() +
  geom_abline(slope= 3 , intercept= 15 )
နည်းလမ်း 2- ဒေါင်လိုက်မျဉ်းတစ်ခုထည့်ရန် geom_vline() ကိုသုံးပါ။
 ggplot(df, aes(x=xvar, y=yvar)) +
    geom_point() +
    geom_vline(xintercept= 5 )
နည်းလမ်း 3- အလျားလိုက်မျဉ်းတစ်ခုထည့်ရန် geom_hline() ကိုသုံးပါ။
 ggplot(df, aes(x=xvar, y=yvar)) +
    geom_point() +
    geom_hline(yintercept= 25 )
Method 4- regression line တစ်ခုထည့်ရန် geom_smooth() ကိုသုံးပါ။
 ggplot(df, aes(x=xvar, y=yvar)) +
    geom_point() +
    geom_smooth(method=' lm ')
အောက်ပါနမူနာများသည် R ရှိ အောက်ပါဒေတာဘောင်ဖြင့် ဤနည်းလမ်းတစ်ခုစီကို လက်တွေ့အသုံးပြုနည်းကို ပြသသည်-
 #create data frame
df <- data. frame (x=c(1, 2, 3, 3, 5, 7, 9),
                 y=c(8, 14, 18, 25, 29, 33, 25))

#view data frame
df

  xy
1 1 8
2 2 14
3 3 18
4 3 25
5 5 29
6 7 33
7 9 25
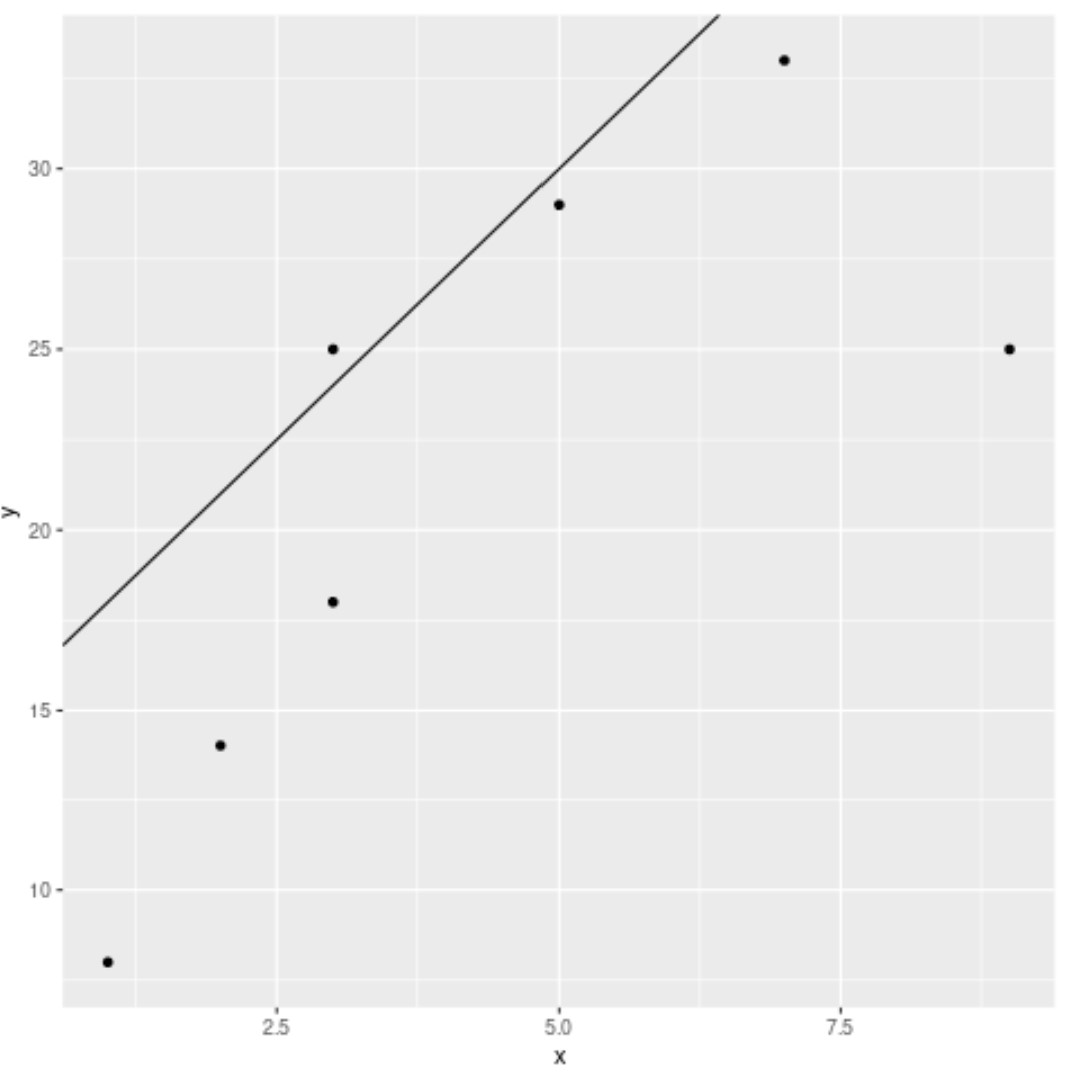
ဥပမာ 1- လျှောစောက်နှင့် လမ်းဆုံမျဉ်းကို ထည့်ရန် geom_abline() ကိုသုံးပါ။
အောက်ဖော်ပြပါကုဒ်သည် မျဉ်းဖြောင့်ကို 3 နှင့် 15 ၏ y-ကြားဖြတ်ပါရှိသော မျဉ်းဖြောင့်တစ်ခုသို့ထည့်ရန် အောက်ပါကုဒ်သည် geom_abline() ကိုအသုံးပြုပုံကို ပြသသည်-
 library (ggplot2)

#create scatterplot and add straight line with specific slope and intercept
ggplot(df, aes(x=x, y=y)) +
  geom_point() +
  geom_abline(slope= 3 , intercept= 15 )
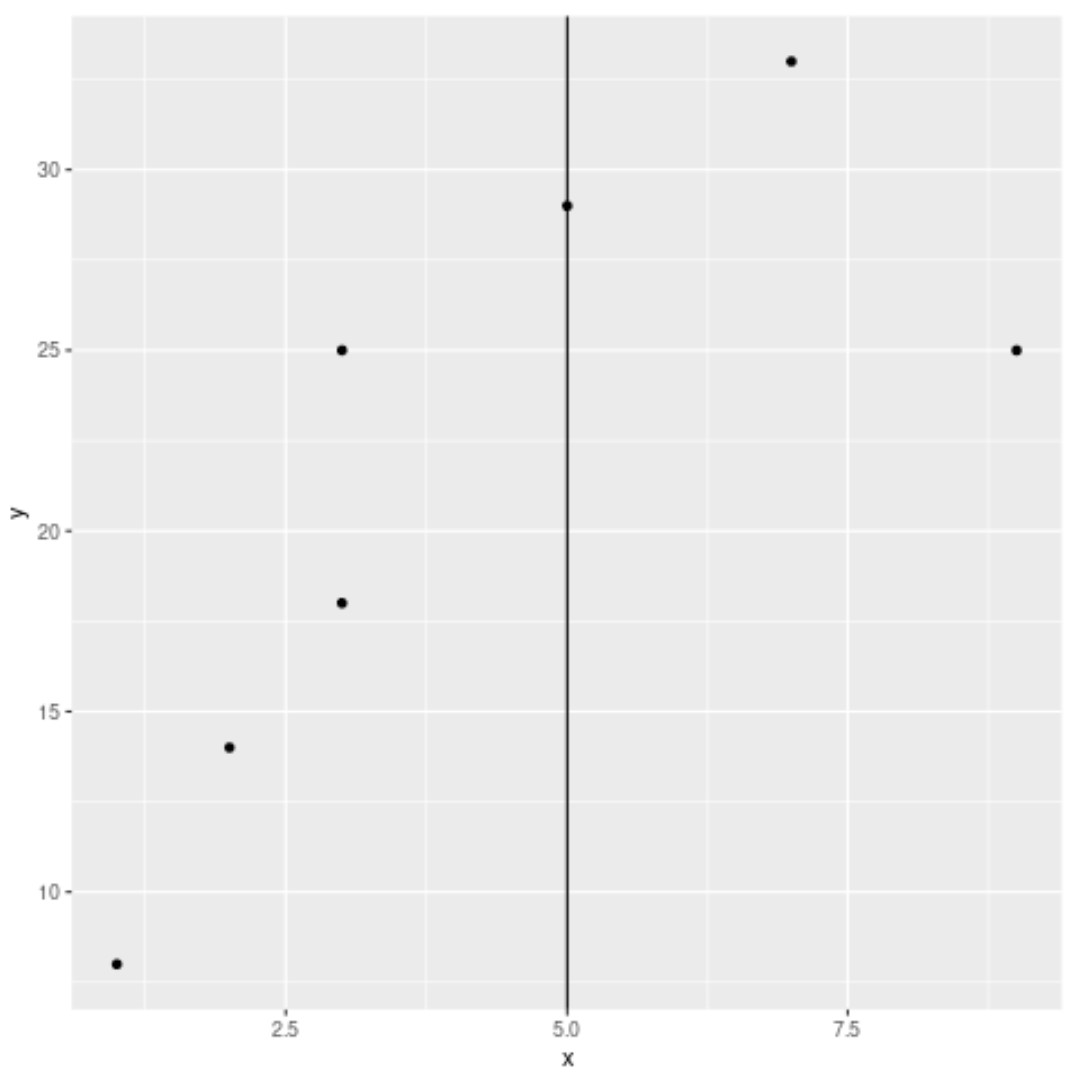
ဥပမာ 2- ဒေါင်လိုက်မျဉ်းတစ်ခုထည့်ရန် geom_vline() ကိုသုံးပါ။
x=5 တွင် ဒေါင်လိုက်မျဉ်းတစ်ကြောင်းကို ဖြန့်ကျက်မှုတစ်ခုသို့ ပေါင်းထည့်ရန် အောက်ပါကုဒ်သည် geom_vline() ကိုအသုံးပြုပုံကို ပြသသည်-
 library (ggplot2)

#create scatterplot and add vertical line at x=5
ggplot(df, aes(x=x, y=y)) +
  geom_point() +
  geom_vline(xintercept= 5 )
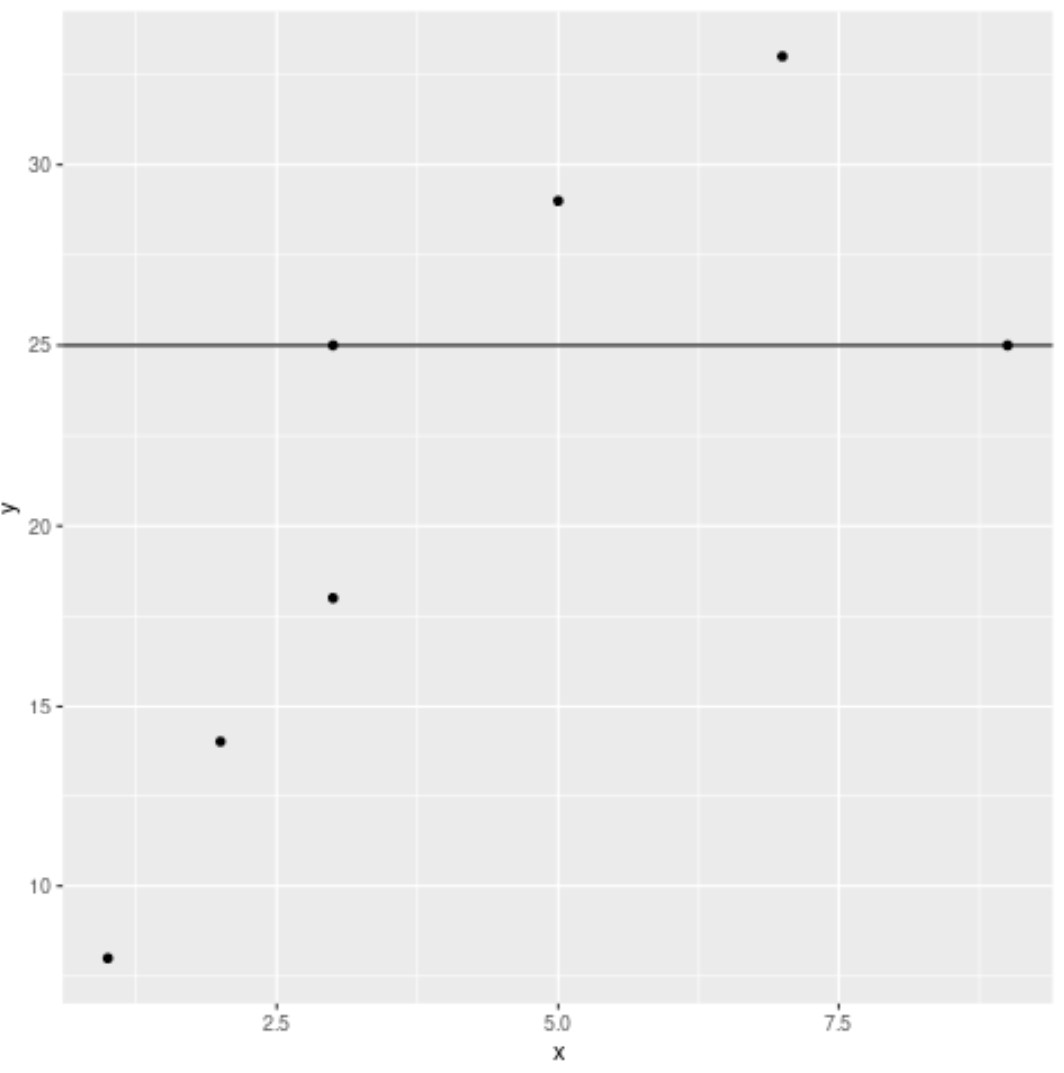
ဥပမာ 3- အလျားလိုက်မျဉ်းတစ်ခုထည့်ရန် geom_hline() ကိုသုံးပါ။
y=25 တွင် အလျားလိုက်မျဉ်းတစ်ခုသို့ အလျားလိုက်မျဉ်းတစ်ခုထည့်ရန် အောက်ပါကုဒ်သည် geom_hline() ကို အသုံးပြုပုံကို ပြသသည်-
 library (ggplot2)

#create scatterplot and add horizontal line at y=25
ggplot(df, aes(x=x, y=y)) +
  geom_point() +
  geom_hline(yintercept= 25 )
ဥပမာ 4- regression line တစ်ခုထည့်ရန် geom_smooth() ကိုသုံးပါ။
အောက်ဖော်ပြပါကုဒ်သည် geom_smooth() ကို ဖြ န့်ကျက်တစ်ခုသို့ တပ်ဆင်ထားသော ဆုတ်ယုတ်မှုမျဉ်းကို ထည့်သွင်းရန် မည်သို့အသုံးပြုရမည်ကို ပြသသည်-
 library (ggplot2)

#create scatterplot and add fitted regression line
ggplot(df, aes(x=x, y=y)) +
  geom_point() +
  geom_smooth(method=' lm ', se= FALSE )
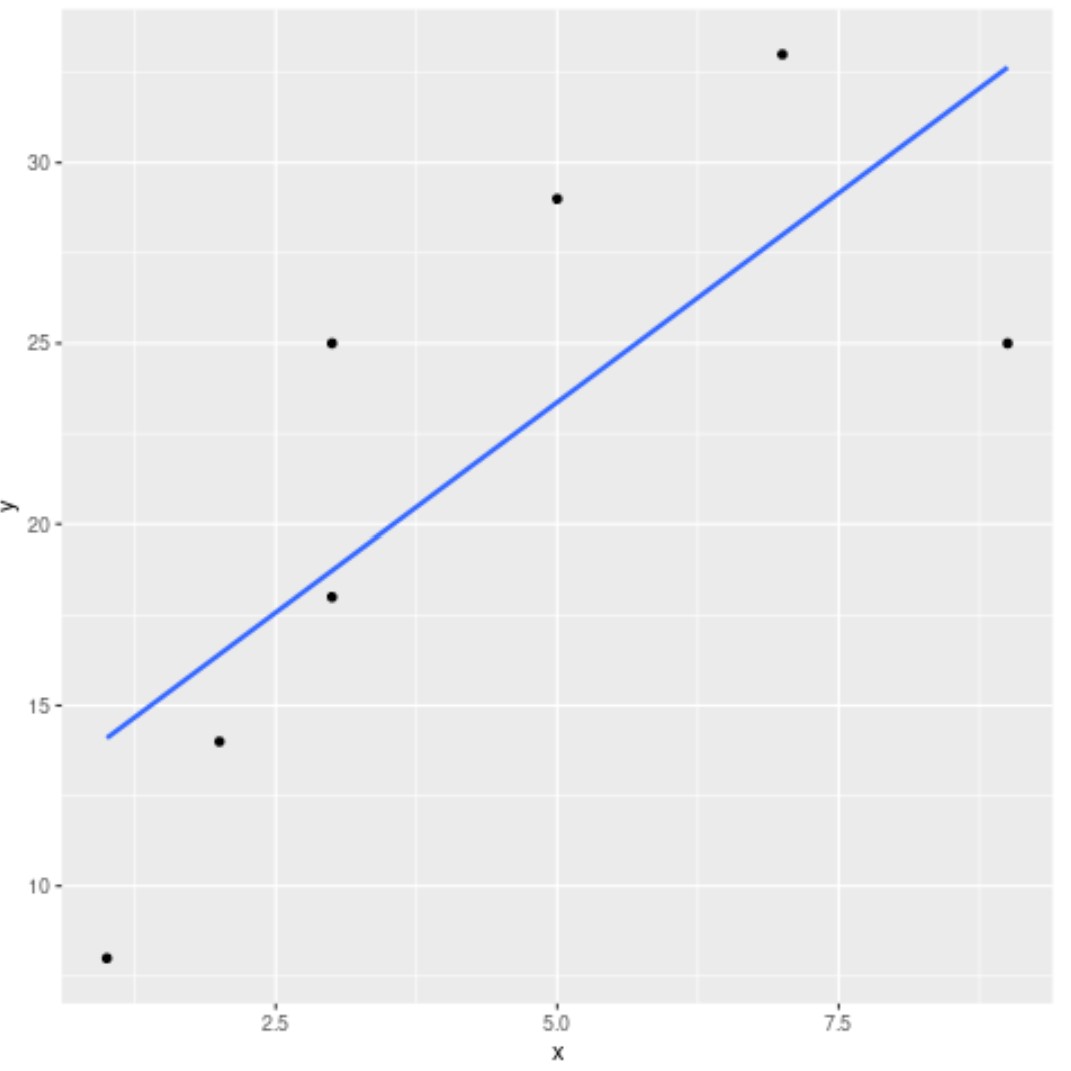
မှတ်ချက် – se=FALSE အငြင်းအခုံက ggplot2 ကို စံအမှားခန့်မှန်းချက်များအတွက် အရိပ်ပြထားသောမျဉ်းကြောင်းများကို မပြသရန် ပြောထားသည်။
ထပ်လောင်းအရင်းအမြစ်များ
အောက်ဖော်ပြပါ သင်ခန်းစာများသည် ggplot2 တွင် အခြားအသုံးများသည့် လုပ်ဆောင်ချက်များကို မည်သို့လုပ်ဆောင်ရမည်ကို ရှင်းပြသည်-
ggplot2 တွင် လိုင်းအထူကို ချိန်ညှိနည်း
ggplot2 တွင် ဝင်ရိုးကန့်သတ်ချက်များကို မည်သို့သတ်မှတ်မည်နည်း။
ggplot2 တွင် gridlines များကိုမည်သို့ဖယ်ရှားနည်း
ggplot2 တွင် နောက်ခံအရောင်ပြောင်းနည်း
စာရေးသူအကြောင်း
Benjamin Anderson
မင်္ဂလာပါ၊ ကျွန်ုပ်သည် အငြိမ်းစား စာရင်းအင်း ပါမောက္ခ ဘင်ဂျမင်ဖြစ်ပြီး သီးသန့် Statorials ဆရာအဖြစ် လှည့်ပတ်ပါသည်။ စာရင်းဇယားနယ်ပယ်တွင် ကျယ်ပြန့်သောအတွေ့အကြုံနှင့် ကျွမ်းကျင်မှုနှင့်အတူ၊ Statorials မှတစ်ဆင့် ကျောင်းသားများကို ခွန်အားဖြစ်စေရန်အတွက် ကျွန်ုပ်၏အသိပညာကို မျှဝေလိုပါသည်။ ပိုသိတယ်။