Seaborn bar plot တွင် bar width ကိုဘယ်လိုပြောင်းမလဲ။
Seaborn bar chart တစ်ခုတွင် bars များ၏ width ကိုပြောင်းလဲရန် width argument ကိုသုံးနိုင်သည်။
sns. barplot (x=' xvar ', y=' yvar ', data=df, width= 0.8 )
အကျယ်အတွက် မူရင်းတန်ဖိုးမှာ 0.8 ဖြစ်သည်။
အကျယ် တန်ဖိုး သေးငယ်လေ၊ အကန့်များ ပိုပါးလေဖြစ်သည်။
အောက်ဖော်ပြပါ ဥပမာသည် ဤအငြင်းအခုံကို လက်တွေ့တွင် မည်သို့အသုံးပြုရမည်ကို ပြသထားသည်။
ဥပမာ- Seaborn Bar Plot ရှိ ဘားများ၏ အကျယ်ကို ပြောင်းပါ။
ကုမ္ပဏီတစ်ခု၏ ဝန်ထမ်းအမျိုးမျိုးမှ ရောင်းချသည့် စုစုပေါင်းရောင်းချမှုဆိုင်ရာ အချက်အလက်များပါရှိသော အောက်ပါပန်ဒါ DataFrame ရှိသည်ဆိုပါစို့။
 import pandas as pd

#createDataFrame
df = pd. DataFrame ({' employee ': ['Andy', 'Bert', 'Chad', 'Doug', 'Eric', 'Frank'],
                   ' sales ': [22, 14, 9, 7, 29, 20]})

#view DataFrame
print (df)

  employee sales
0 Andy 22
1 Bert 14
2 Chad 9
3 Doug 7
4 Eric 29
5 Frank 20
အကျယ် အတွက် 0.8 ၏ ပုံသေတန်ဖိုးကို အသုံးပြု၍ Seaborn တွင် ဘားကွက်ကွက်တစ်ခုကို ဖန်တီးရန် အောက်ပါ syntax ကို အသုံးပြုနိုင်သည်။
 import seaborn as sns

#create bar plot with default width
sns. barplot (x=' employee ', y=' sales ', data=df). set (title=' Default Width ')
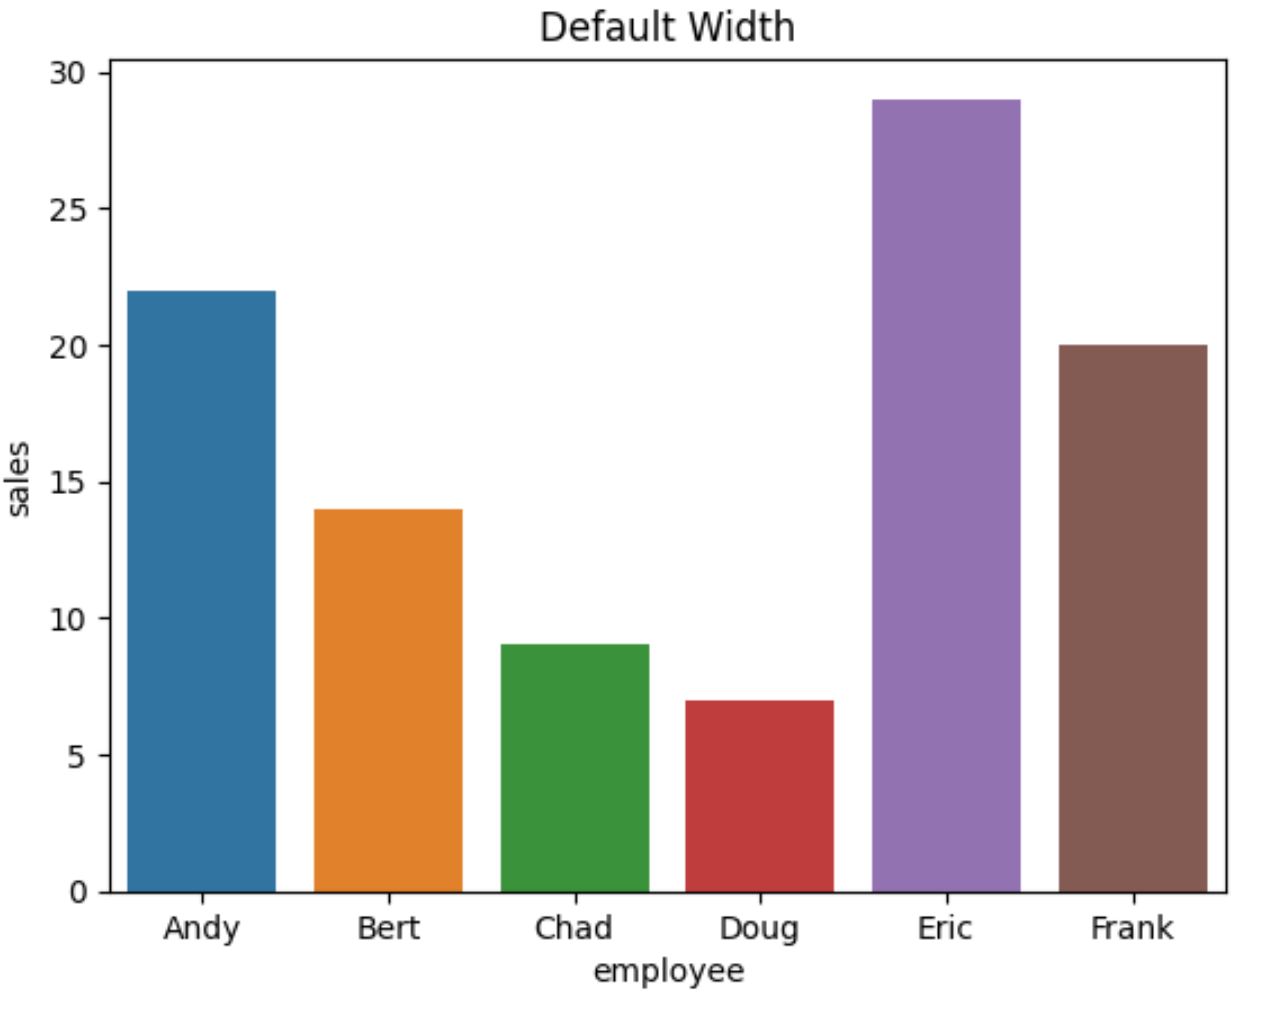
အောက်ပါကုဒ်သည် 0.4 နှင့်ညီသော width argument ကိုသတ်မှတ်ခြင်းဖြင့် bar တစ်ခုစီ၏ width ကိုမည်သို့လျှော့ချရမည်ကိုပြသသည်:
 import seaborn as sns

#create bar plot with width = 0.4
sns. barplot (x=' employee ', y=' sales ', data=df, width= 0.4 ). set (title=' Width = 0.4 ')
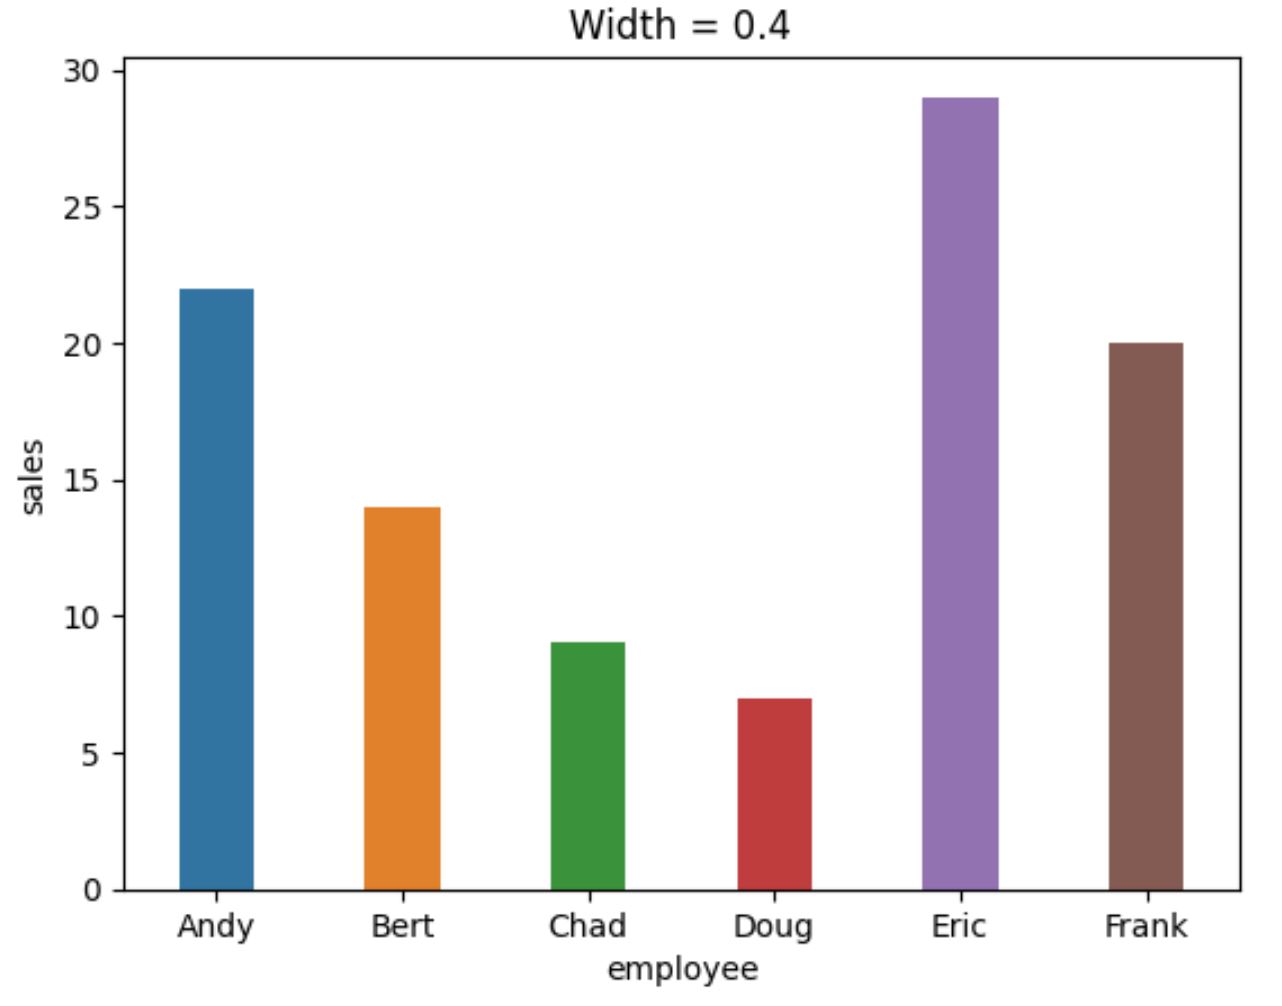
ဘားများသည် ယခင်ပုံစံနှင့် နှိုင်းယှဉ်ပါက ဤကွက်လပ်တွင် ပိုမိုပါးလွှာသည်ကို သတိပြုပါ။
ဘားတစ်ခုချင်းစီကို တစ်ခုနဲ့တစ်ခု ထိချင်ရင် အကျယ်ကို 1 နဲ့ ညီအောင် သတ်မှတ်နိုင်ပါတယ်။
 import seaborn as sns

#create bar plot with width = 1
sns. barplot (x=' employee ', y=' sales ', data=df, width= 1 ). set (title=' Width = 1 ')
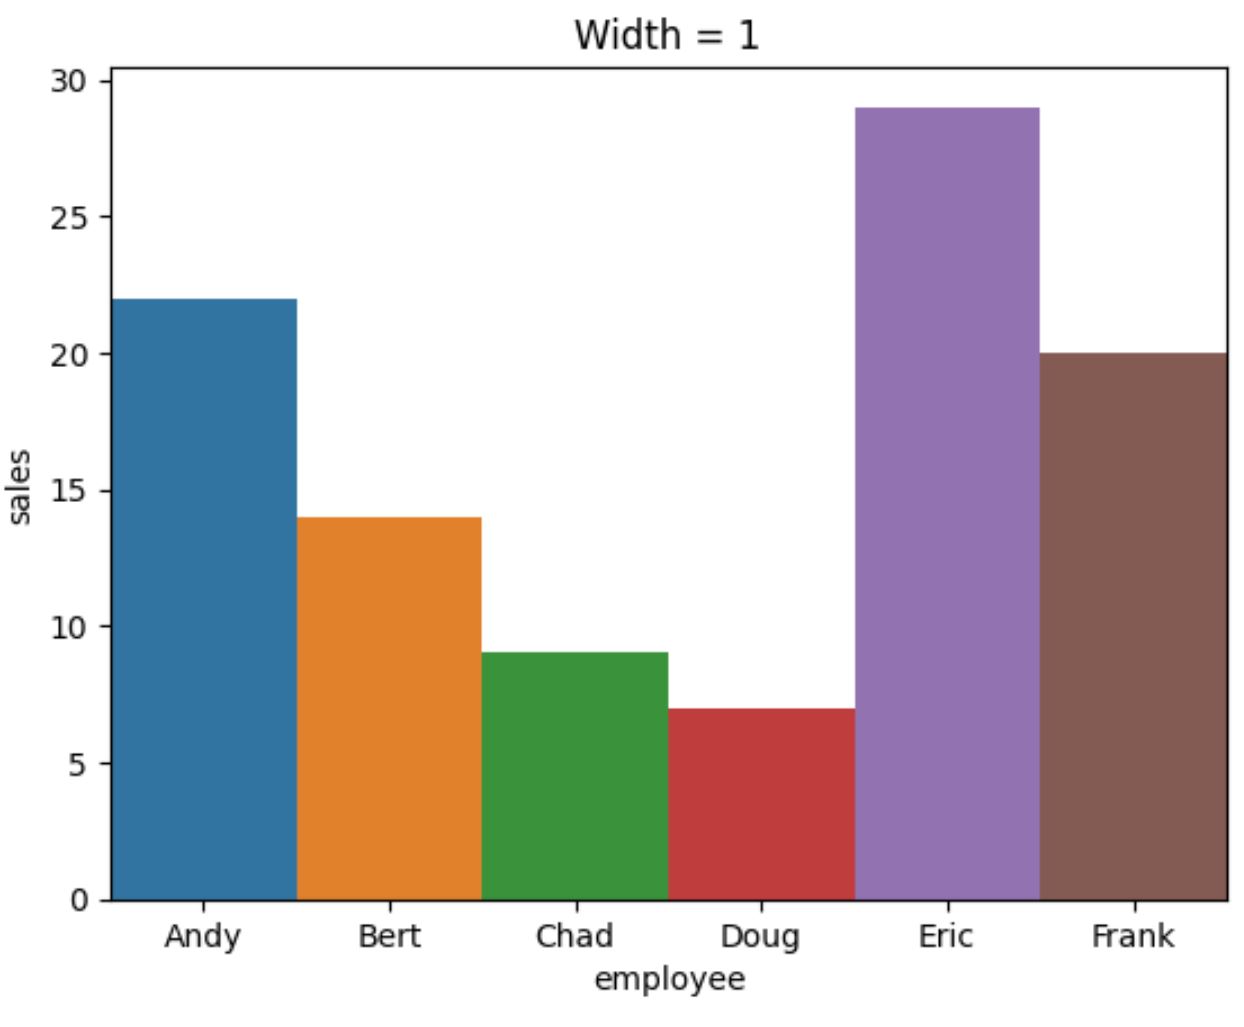
အကျယ်ကို 1 ထက်ကြီးသောတန်ဖိုးအဖြစ် သတ်မှတ်ပါက၊ ဘားများ ထပ်နေမည်ကို သတိပြုပါ။
မှတ်ချက် – seaborn ရှိ barplot() function ၏ စာရွက်စာတမ်းအပြည့်အစုံကို ဤနေရာတွင် ရှာတွေ့နိုင်ပါသည်။
ထပ်လောင်းအရင်းအမြစ်များ
အောက်ဖော်ပြပါ သင်ခန်းစာများသည် ပင်လယ်မွေးတွင် အခြားဘုံလုပ်ဆောင်ချက်များကို မည်သို့လုပ်ဆောင်ရမည်ကို ရှင်းပြသည်-
Seaborn Barplot တွင် တန်ဖိုးများပြသနည်း
Seaborn တွင် အုပ်စုဖွဲ့ barplot ဖန်တီးနည်း
Seaborn barplot တွင်ဘားများ၏အရောင်သတ်မှတ်နည်း
စာရေးသူအကြောင်း
Benjamin Anderson
မင်္ဂလာပါ၊ ကျွန်ုပ်သည် အငြိမ်းစား စာရင်းအင်း ပါမောက္ခ ဘင်ဂျမင်ဖြစ်ပြီး သီးသန့် Statorials ဆရာအဖြစ် လှည့်ပတ်ပါသည်။ စာရင်းဇယားနယ်ပယ်တွင် ကျယ်ပြန့်သောအတွေ့အကြုံနှင့် ကျွမ်းကျင်မှုနှင့်အတူ၊ Statorials မှတစ်ဆင့် ကျောင်းသားများကို ခွန်အားဖြစ်စေရန်အတွက် ကျွန်ုပ်၏အသိပညာကို မျှဝေလိုပါသည်။ ပိုသိတယ်။