Pandas dataframe မှ boxplot တစ်ခုကို ဖန်တီးနည်း
pandas DataFrame မှ boxplots များကိုဖန်တီးရန် အောက်ပါ syntax ကို သင်အသုံးပြုနိုင်ပါသည်။
 #create boxplot of one column
df. boxplot (column=[' col1 '])

#create boxplot of multiple columns
df. boxplot (column=[' col1 ', ' col2 '])

#create boxplot grouped by one column
df. boxplot (column=[' col1 '], by=' col2 ')
အောက်ပါဥပမာများသည် အောက်ပါ DataFrame ဖြင့် လက်တွေ့တွင် ဤ syntax ကိုမည်သို့အသုံးပြုရမည်ကိုပြသသည်-
 import pandas as pd

#createDataFrame
df = pd. DataFrame ({' conference ': ['A', 'A', 'A', 'B', 'B', 'B'],
                   ' points ': [5, 7, 7, 9, 12, 9],
                   ' assists ': [11, 8, 10, 6, 6, 5],
                   ' rebounds ': [4, 2, 5, 8, 6, 11],})

#view DataFrame
df
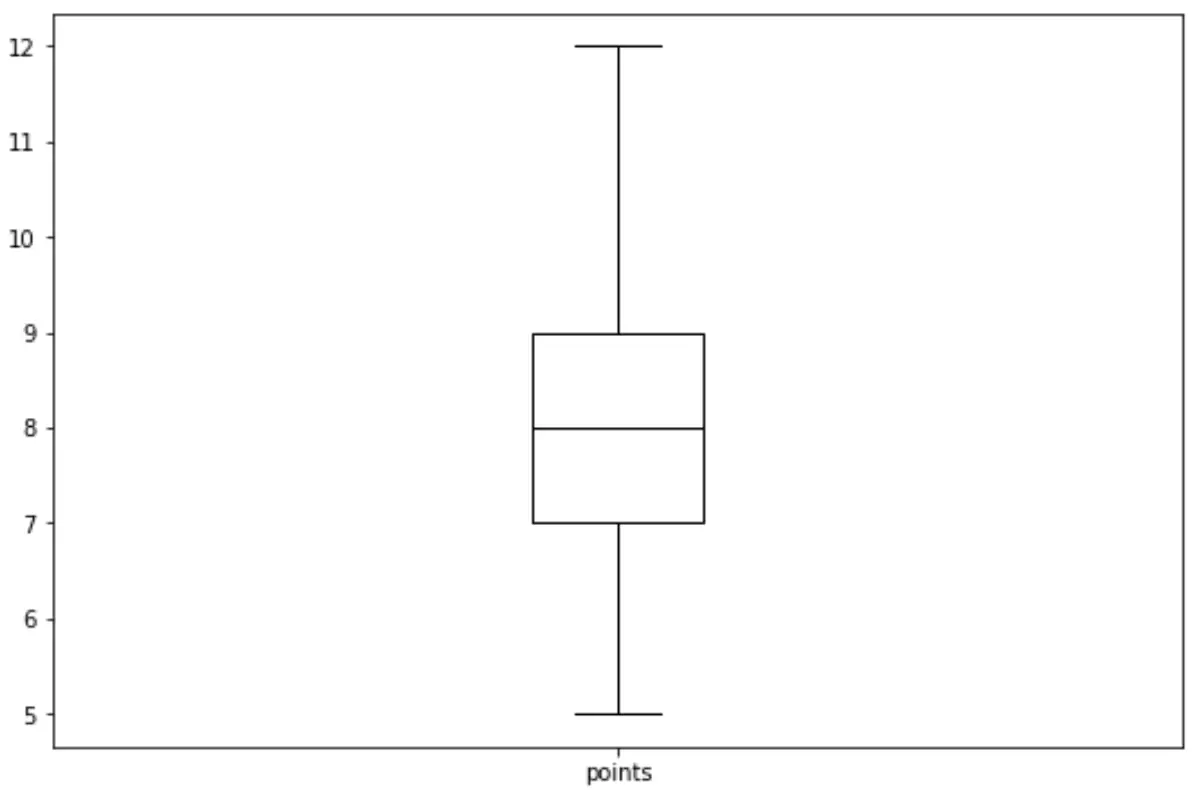
ဥပမာ 1- ကော်လံတစ်ခု၏ အကွက်ကွက်
အောက်ပါ ကုဒ်သည် ပန်ဒါ DataFrame ရှိ ကော်လံတစ်ခုအတွက် boxplot တစ်ခုကို ဖန်တီးနည်းကို ပြသသည် ။
df. boxplot (column=[' points '], grid= False , color=' black ')
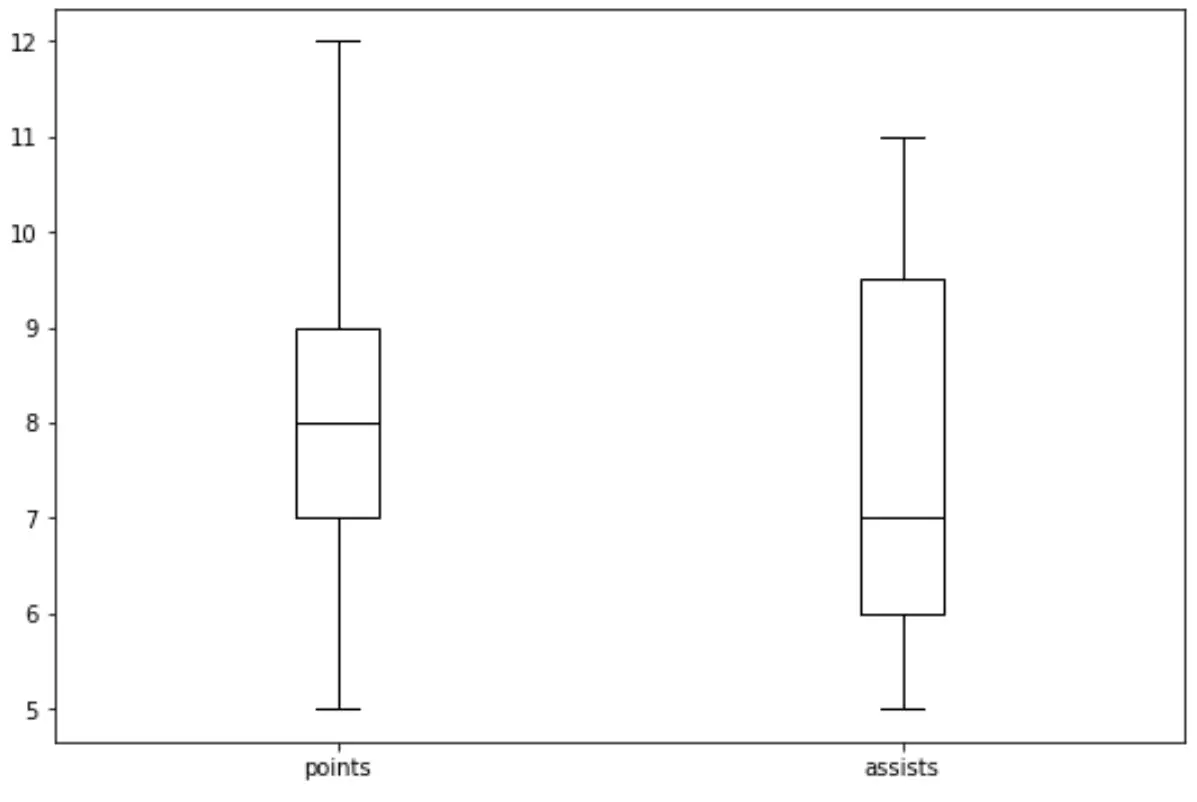
ဥပမာ 2- ကော်လံအများအပြား၏ အကွက်ကွက်
အောက်ပါ ကုဒ်သည် ပန်ဒါ DataFrame ရှိ ကော်လံများစွာအတွက် boxplot တစ်ခုကို ဖန်တီးနည်းကို ပြသသည်-
df. boxplot (column=[' points ', ' assists '], grid= False , color=' black ')
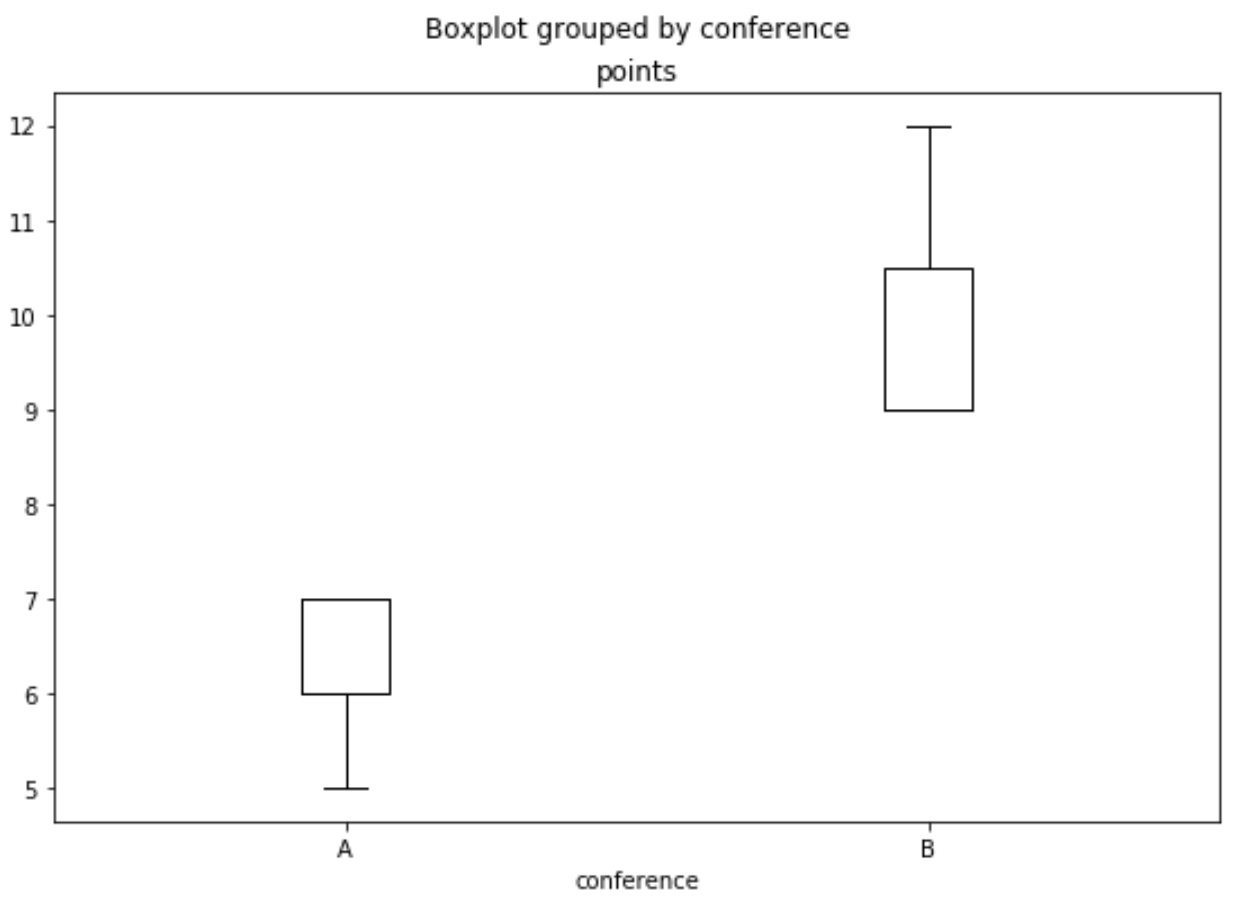
ဥပမာ 3- ကော်လံတစ်ခုဖြင့် အုပ်စုဖွဲ့ထားသော Boxplot
အောက်ပါကုဒ်သည် ပန်ဒါဒေတာဘောင်တွင် ကော်လံတစ်ခုဖြင့် အုပ်စုဖွဲ့ထားသော boxplot တစ်ခုကို ဖန်တီးနည်းကို ပြသသည်-
df. boxplot (column=[' points '], by=' conference ', grid= False , color=' black ')
ထပ်လောင်းအရင်းအမြစ်များ
Pandas: ဇာတ်လမ်းတွဲပေါင်းများစွာကို ဘယ်လိုဆွဲမလဲ။
Pandas- ဘားကားချပ်တစ်ခုပေါ်တွင် ကော်လံများစွာကို ဘယ်လိုဆွဲမလဲ။
စာရေးသူအကြောင်း
Benjamin Anderson
မင်္ဂလာပါ၊ ကျွန်ုပ်သည် အငြိမ်းစား စာရင်းအင်း ပါမောက္ခ ဘင်ဂျမင်ဖြစ်ပြီး သီးသန့် Statorials ဆရာအဖြစ် လှည့်ပတ်ပါသည်။ စာရင်းဇယားနယ်ပယ်တွင် ကျယ်ပြန့်သောအတွေ့အကြုံနှင့် ကျွမ်းကျင်မှုနှင့်အတူ၊ Statorials မှတစ်ဆင့် ကျောင်းသားများကို ခွန်အားဖြစ်စေရန်အတွက် ကျွန်ုပ်၏အသိပညာကို မျှဝေလိုပါသည်။ ပိုသိတယ်။