R တွင် facet_wrap ကိုအသုံးပြုနည်း (ဥပမာများနှင့်အတူ)
facet_wrap() လုပ်ဆောင်ချက်ကို ggplot2 တွင် multi-panel ကွက်များထုတ်လုပ်ရန် အသုံးပြုနိုင်သည်။
ဤလုပ်ဆောင်ချက်သည် အောက်ပါအခြေခံ syntax ကိုအသုံးပြုသည်-
 library (ggplot2)

ggplot(df, aes (x_var, y_var)) +
  geom_point() +
  facet_wrap(vars(category_var))
အောက်ပါနမူနာများသည် R ရှိ built-in mpg ဒေတာအစုံဖြင့် ဤလုပ်ဆောင်ချက်ကို အသုံးပြုနည်းကို ပြသသည်-
 #view first six rows of mpg dataset
head(mpg)

manufacturer model displ year cyl trans drv cty hwy fl class

audi a4 1.8 1999 4 auto(l5) f 18 29 p compact
audi a4 1.8 1999 4 manual(m5) f 21 29 p compact
audi a4 2.0 2008 4 manual(m6) f 20 31 p compact
audi a4 2.0 2008 4 auto(front) f 21 30 p compact
audi a4 2.8 1999 6 auto(l5) f 16 26 p compact
audi a4 2.8 1999 6 manual(m5) f 18 26 p compact
ဥပမာ 1- facet_wrap() အခြေခံလုပ်ဆောင်ချက်
အောက်ပါကုဒ်သည် displ ကို အသုံးပြု၍ x-axis variable၊ y-axis variable အဖြစ် hwy ၊ နှင့် grouping variable အဖြစ် class ကို အသုံးပြု၍ ggplot2 တွင် များပြားသော scatterplot များကို မည်သို့ဖန်တီးရမည်ကို ပြသသည်-
 ggplot(mpg, aes (displ, hwy)) +
  geom_point() +
  facet_wrap(vars(class))

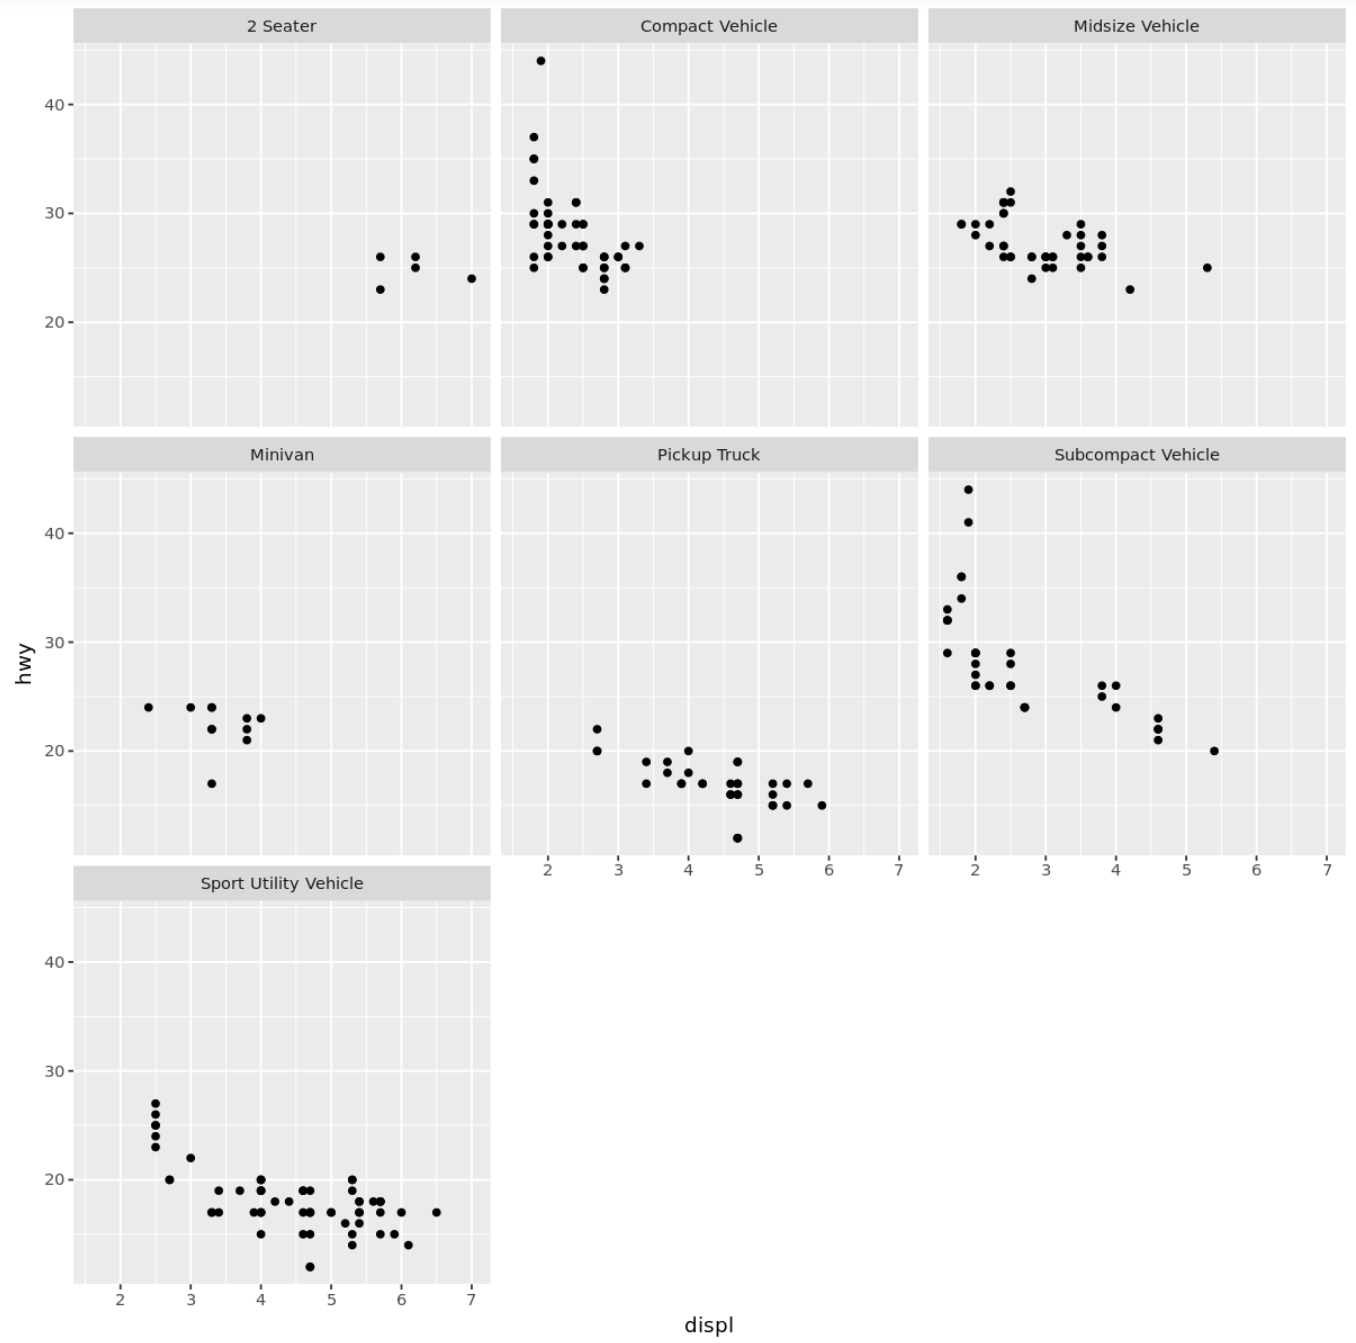
ဥပမာ 2- စိတ်ကြိုက်တံဆိပ်များကို အသုံးပြုပါ။
အောက်ဖော်ပြပါ ကုဒ်သည် ကွက်ကွက်ခေါင်းစဉ်များအတွက် စိတ်ကြိုက်အညွှန်းများဖြင့် facet_wrap() လုပ်ဆောင်ချက်ကို အသုံးပြုပုံကို ပြသသည်-
 #define custom labels
plot_names <- c('2seater' = "2 Seater",
                'compact' = "Compact Vehicle",
                'midsize' = "Midsize Vehicle",
                'minivan' = "Minivan",
                'pickup' = "Pickup Truck",
                'subcompact' = "Subcompact Vehicle",
                'suv' = "Sport Utility Vehicle")

#use facet_wrap with custom plot labels
ggplot(mpg, aes (displ, hwy)) +
  geom_point() +
  facet_wrap(vars(class), labeller = as_labeller (plot_names))
ဥပမာ 3- စိတ်ကြိုက်စကေးကိုသုံးပါ။
အောက်ဖော်ပြပါကုဒ်သည် ကွက်ကွက်တစ်ခုစီအတွက် facet_wrap() လုပ်ဆောင်ချက်ကို စိတ်ကြိုက်စကေးများဖြင့် မည်သို့အသုံးပြုရမည်ကို ပြသသည်-
 #use facet_wrap with custom scales
ggplot(mpg, aes (displ, hwy)) +
  geom_point() +
  facet_wrap(vars(class), scales=' free ')

ဥပမာ 4- စိတ်ကြိုက် command ကိုသုံးပါ။
အောက်ဖော်ပြပါကုဒ်သည် မြေကွက်တစ်ခုစီအတွက် စိတ်ကြိုက်အမှာစာဖြင့် facet_wrap() လုပ်ဆောင်ချက်ကို မည်သို့အသုံးပြုရမည်ကို ပြသသည်-
 #define order for plots
mpg <- within(mpg, class <- factor(class, levels=c(' compact ', ' 2seater ', ' suv ',
                                                   ' subcompact ', ' pickup ',
                                                   ' minivan ', ' midsize ')))

#use facet_wrap with custom order
ggplot(mpg, aes (displ, hwy)) +
  geom_point() +
  facet_wrap(vars(class))
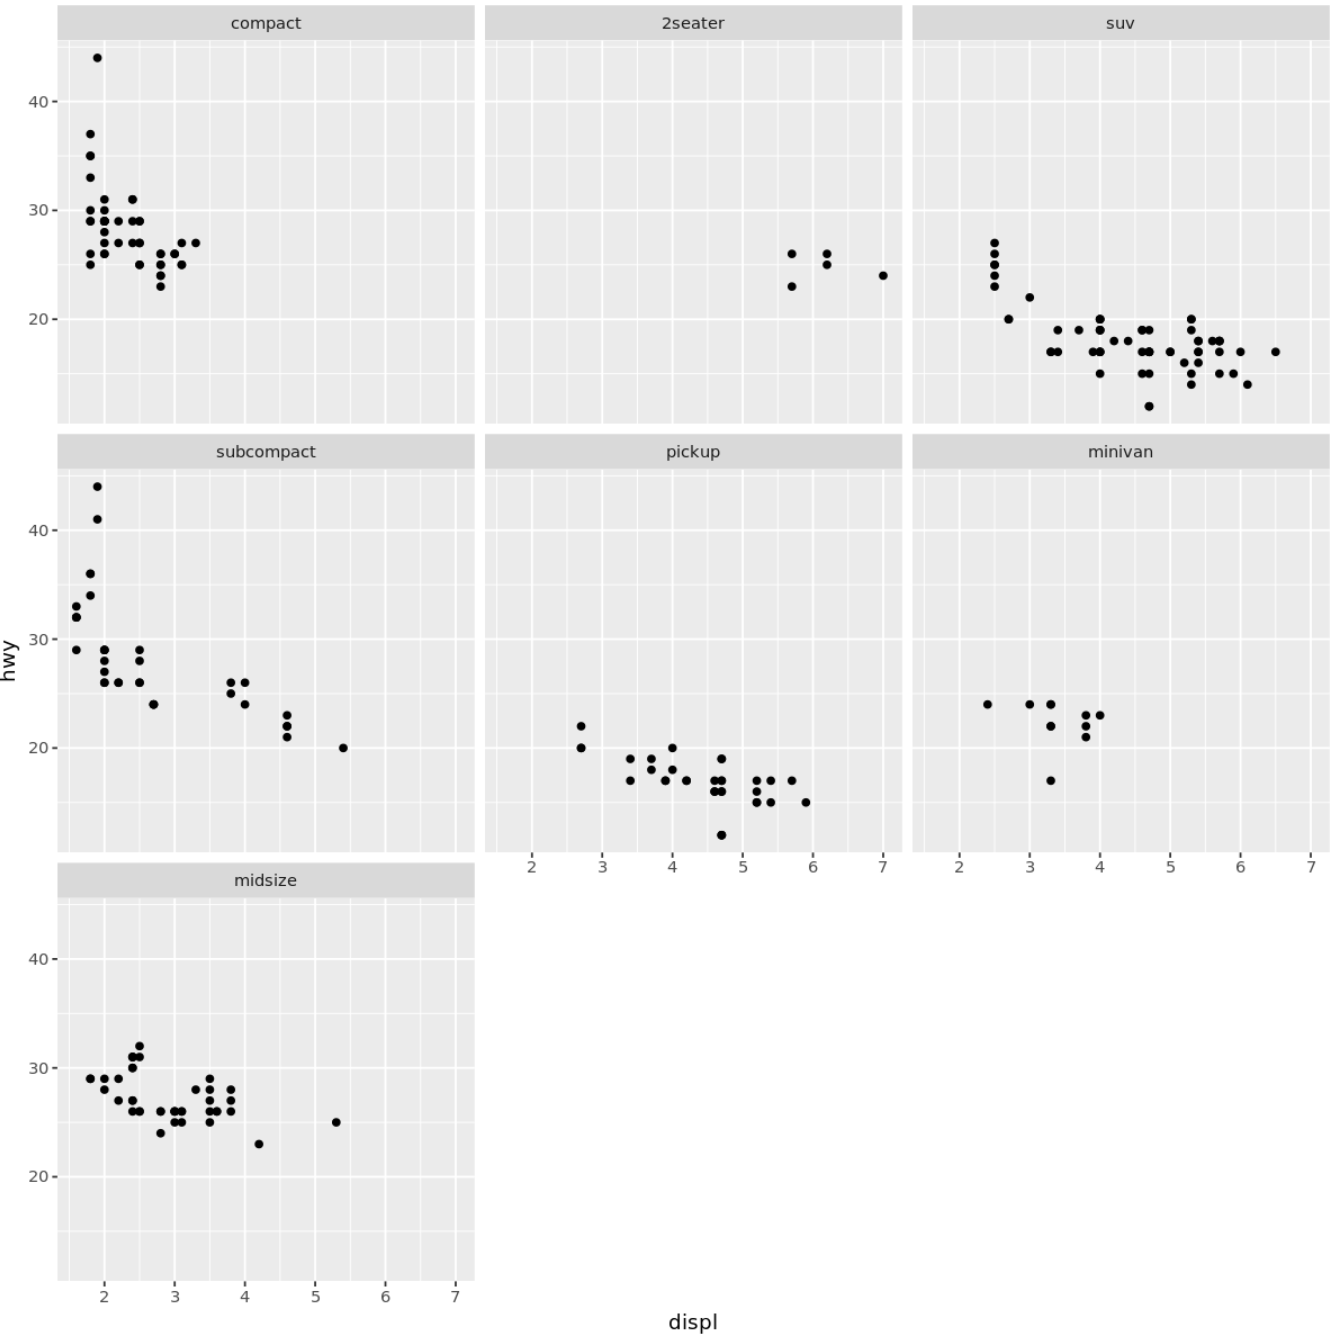
ကျွန်ုပ်တို့သတ်မှတ်ထားသော အစီအစဥ်အတိုင်း ကွက်ကွက်များ ပေါ်လာသည်ကို သတိပြုပါ။
ထပ်လောင်းအရင်းအမြစ်များ
ggplot2 မှာ ဖောင့်အရွယ်အစားကို ဘယ်လိုပြောင်းမလဲ။
ggplot2 တွင်ဒဏ္ဍာရီကိုမည်သို့ဖယ်ရှားနည်း
ggplot2 တွင် ဝင်ရိုးတံဆိပ်များကို လှည့်နည်း
စာရေးသူအကြောင်း
Benjamin Anderson
မင်္ဂလာပါ၊ ကျွန်ုပ်သည် အငြိမ်းစား စာရင်းအင်း ပါမောက္ခ ဘင်ဂျမင်ဖြစ်ပြီး သီးသန့် Statorials ဆရာအဖြစ် လှည့်ပတ်ပါသည်။ စာရင်းဇယားနယ်ပယ်တွင် ကျယ်ပြန့်သောအတွေ့အကြုံနှင့် ကျွမ်းကျင်မှုနှင့်အတူ၊ Statorials မှတစ်ဆင့် ကျောင်းသားများကို ခွန်အားဖြစ်စေရန်အတွက် ကျွန်ုပ်၏အသိပညာကို မျှဝေလိုပါသည်။ ပိုသိတယ်။