Ggplot2 တွင် geom_vline သို့ အညွှန်းတစ်ခုထည့်နည်း
ggplot2 ရှိ ဒေါင်လိုက်မျဉ်းတစ်ခုသို့ အညွှန်းတစ်ခုထည့်ရန် အောက်ပါအခြေခံအထားအသိုကိုသုံးနိုင်သည်။
+ annotate(" text ", x= 9 , y= 20 , label=" Here is my text ", angle= 90 )
အောက်ပါဥပမာများသည် ဤ syntax ကိုလက်တွေ့တွင်မည်သို့အသုံးပြုရမည်ကိုပြသထားသည်။
ဥပမာ 1- geom_vline သို့ အညွှန်းတစ်ခုထည့်ပါ။
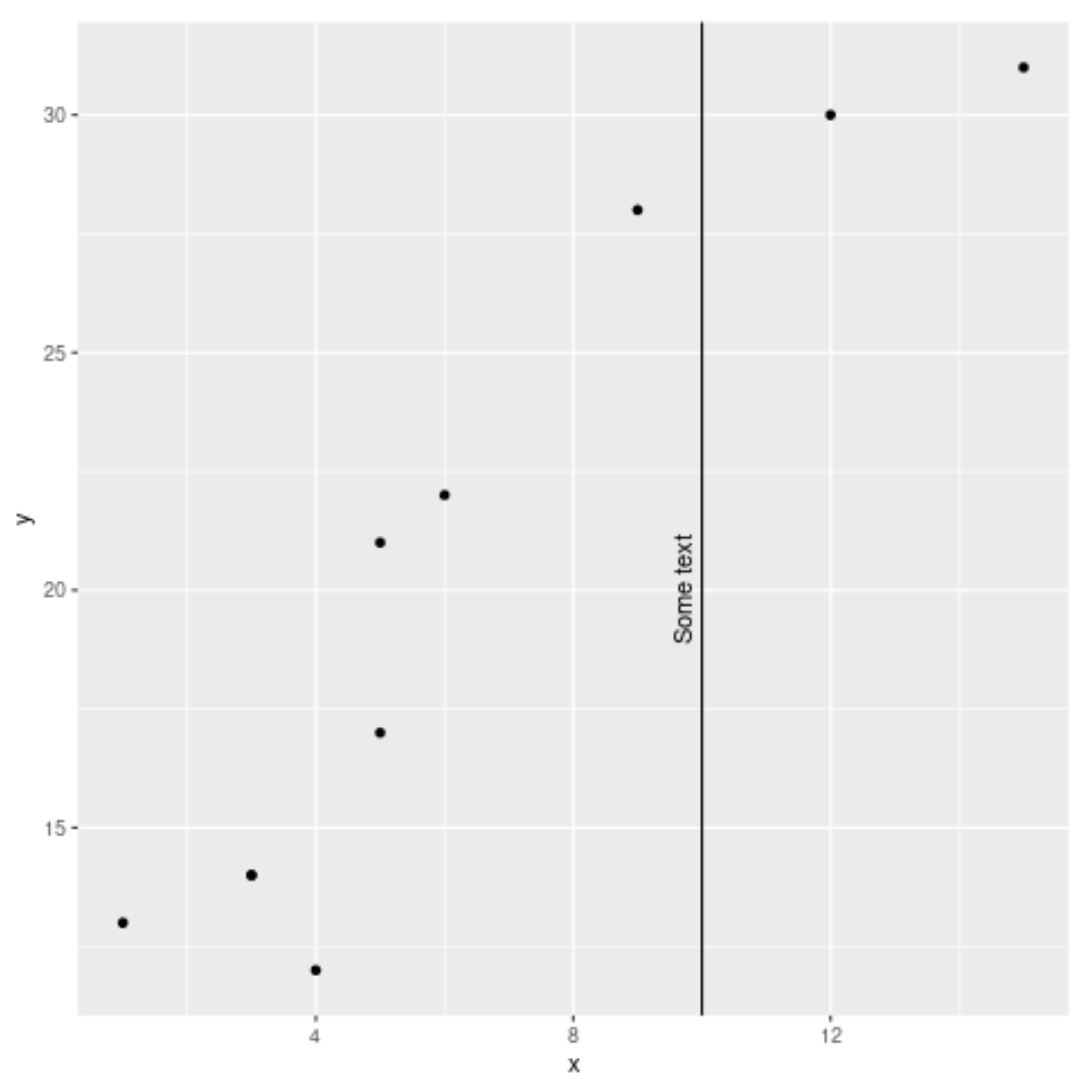
အောက်ပါကုဒ်သည် ggplot2 တွင် အညွှန်းတစ်ခုအား ဒေါင်လိုက်မျဉ်းတစ်ခုသို့ မည်သို့ထည့်ရမည်ကို ပြသသည်-
 library (ggplot2)

#create data frame
df <- data. frame (x=c(1, 3, 3, 4, 5, 5, 6, 9, 12, 15),
                 y=c(13, 14, 14, 12, 17, 21, 22, 28, 30, 31))

#create scatterplot with vertical line at x=10
ggplot(df, aes(x=x, y=y)) +
geom_point() +
  geom_vline(xintercept= 10 ) +
  annotate("text", x= 9.7 , y= 20 , label=" Some text ", angle= 90 )
ဥပမာ 2- geom_vline သို့ စိတ်ကြိုက်တံဆိပ်တစ်ခု ထည့်ပါ။
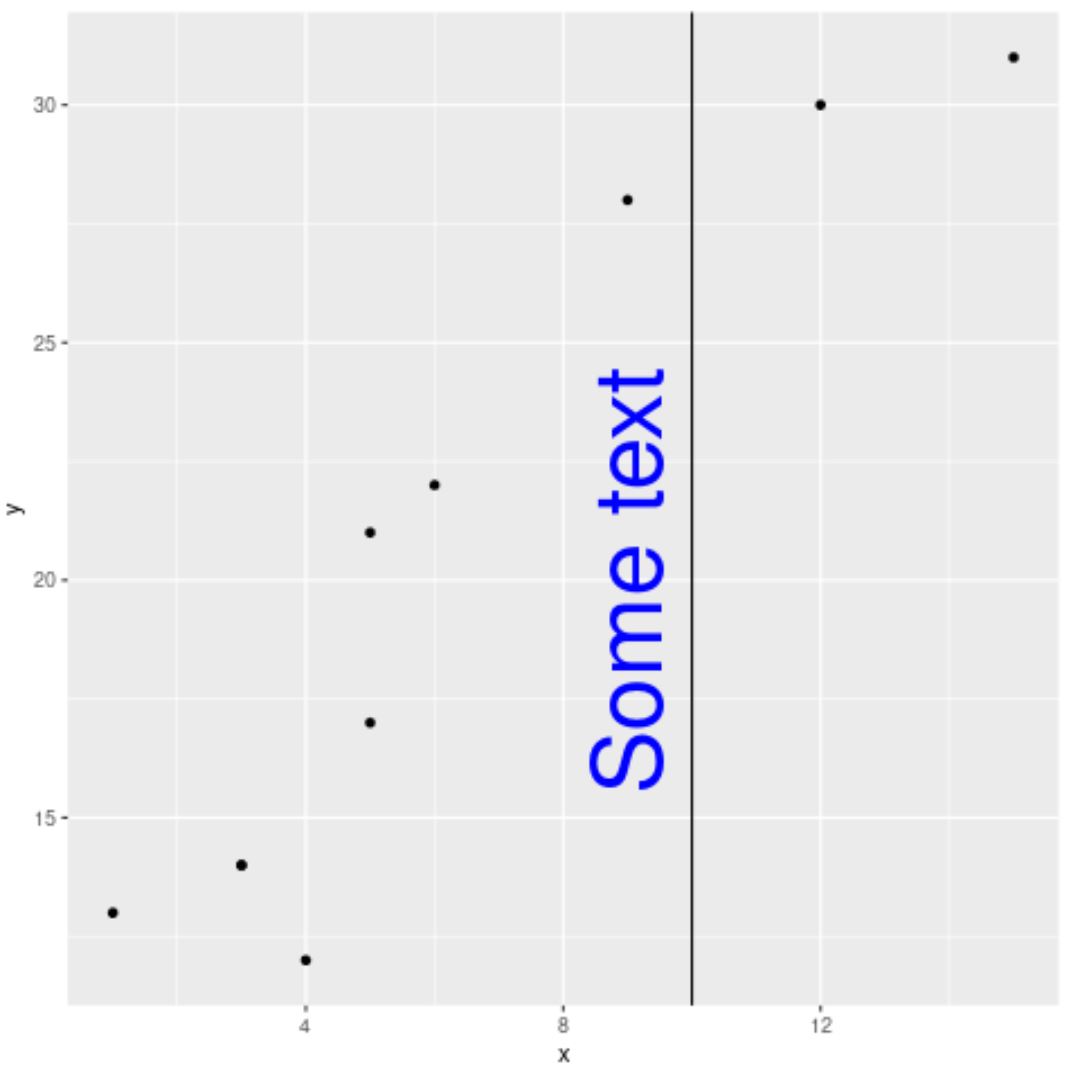
အောက်ပါကုဒ်သည် ggplot2 ရှိ ဒေါင်လိုက်မျဉ်းတစ်ခုသို့ စိတ်ကြိုက် အရွယ်အစား နှင့် အရောင်ပါသော အညွှန်းတစ်ခုထည့်ရန် အရွယ်အစားနှင့် အရောင် အငြင်းအခုံများကို မည်သို့အသုံးပြုရမည်ကို ပြသသည်-
 library (ggplot2)

#create data frame
df <- data. frame (x=c(1, 3, 3, 4, 5, 5, 6, 9, 12, 15),
                 y=c(13, 14, 14, 12, 17, 21, 22, 28, 30, 31))

#create scatterplot with vertical line at x=10
ggplot(df, aes(x=x, y=y)) +
geom_point() +
  geom_vline(xintercept= 10 ) +
  annotate("text", x= 9 , y= 20 , label=" Some text ", angle= 90 , size= 15 , color=" blue ")
ဥပမာ 3- geom_vline သို့ အညွှန်းများစွာထည့်ပါ။
အောက်ဖော်ပြပါကုဒ်သည် ggplot2 ရှိ ဒေါင်လိုက်မျဉ်းတစ်ခုသို့ အညွှန်းများစွာထည့်ရန် annotate() လုပ်ဆောင်ချက်ကို အကြိမ်များစွာအသုံးပြုပုံကို ပြသသည်-
 library (ggplot2)

#create data frame
df <- data. frame (x=c(1, 3, 3, 4, 5, 5, 6, 9, 12, 15),
                 y=c(13, 14, 14, 12, 17, 21, 22, 28, 30, 31))

#create scatterplot with vertical line at x=10
ggplot(df, aes(x=x, y=y)) +
geom_point() +
  geom_vline(xintercept= 10 ) +
  annotate("text", x= 9 , y= 20 , label=" Some text ", angle= 90 , size= 15 , color=" blue ") +
  annotate("text", x= 11 , y= 20 , label=" More text ", angle= 90 , size= 13 , color=" red ")
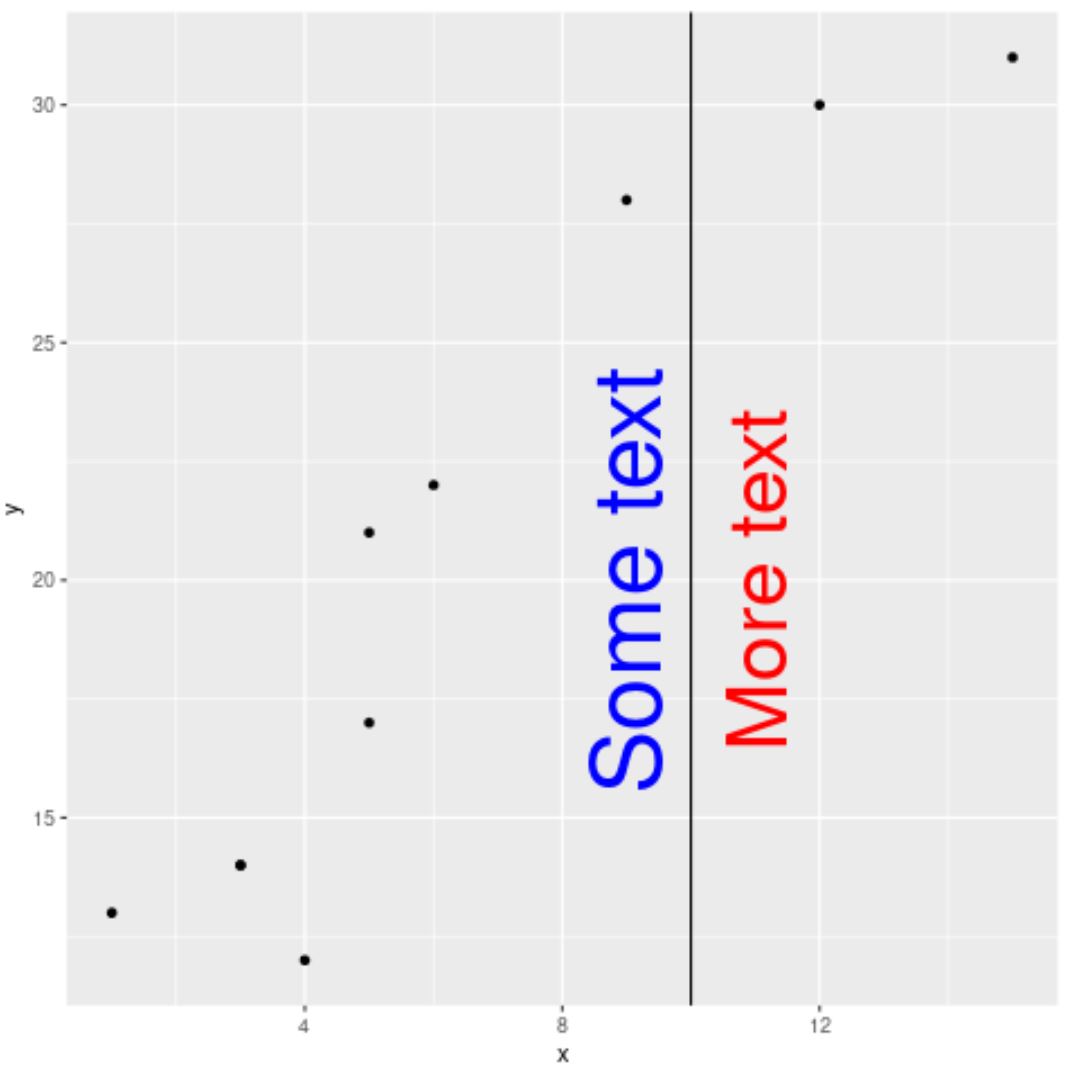
သင်ဇာတ်ကွက်တွင် အညွှန်းများထည့်လိုသည့်အတိုင်း annotate() လုပ်ဆောင်ချက်ကို အကြိမ်များစွာ အသုံးပြုရန် အားမနာပါ။
ထပ်လောင်းအရင်းအမြစ်များ
အောက်ဖော်ပြပါ သင်ခန်းစာများသည် ggplot2 တွင် အခြားဘုံအလုပ်များကို မည်သို့လုပ်ဆောင်ရမည်ကို ရှင်းပြသည်-
ggplot2 တွင် linear regression line ကို ဘယ်လိုဆွဲမလဲ။
ggplot2 တွင် ဝင်ရိုးကန့်သတ်ချက်များကို မည်သို့သတ်မှတ်မည်နည်း။
ggplot2 တွင် ဘေးချင်းကပ်ကွက်များ ဖန်တီးနည်း
စာရေးသူအကြောင်း
Benjamin Anderson
မင်္ဂလာပါ၊ ကျွန်ုပ်သည် အငြိမ်းစား စာရင်းအင်း ပါမောက္ခ ဘင်ဂျမင်ဖြစ်ပြီး သီးသန့် Statorials ဆရာအဖြစ် လှည့်ပတ်ပါသည်။ စာရင်းဇယားနယ်ပယ်တွင် ကျယ်ပြန့်သောအတွေ့အကြုံနှင့် ကျွမ်းကျင်မှုနှင့်အတူ၊ Statorials မှတစ်ဆင့် ကျောင်းသားများကို ခွန်အားဖြစ်စေရန်အတွက် ကျွန်ုပ်၏အသိပညာကို မျှဝေလိုပါသည်။ ပိုသိတယ်။