Ggplot2 ကွက်များသို့ ဒဏ္ဍာရီထည့်နည်း (ဥပမာ 3 ခု)
ggplot2 တွင် ဒဏ္ဍာရီတစ်ခုထည့်ရန် အောက်ပါနည်းလမ်းများကို သင်သုံးနိုင်သည်။
နည်းလမ်း 1- မူရင်းတည်နေရာသို့ စာတန်းတစ်ခုထည့်ပါ။
 p+
  labs(caption = " This is my caption ")
နည်းလမ်း 2- စိတ်ကြိုက်တည်နေရာတွင် စာတန်းတစ်ခုထည့်ပါ။
 p+
  labs(caption = " This is my caption ") +
  theme(plot. caption = element_text(hjust= 0 ))
နည်းလမ်း 3- စာတန်းတစ်ခုထည့်ကာ စာသားကို စိတ်ကြိုက်ပြင်ဆင်ပါ။
 p+
  labs(caption = " This is my caption ") +
  theme(plot. caption = element_text(size= 16 , color=" red ", face=" italic "))
အောက်ဖော်ပြပါ ဥပမာများသည် R ရှိ ဒေတာဘောင်ဖြင့် လက်တွေ့တွင် နည်းလမ်းတစ်ခုစီကို အသုံးပြုနည်းကို ပြသသည်-
 #create data frame
df <- data. frame (assists=c(1, 2, 2, 3, 5, 6, 7, 8, 8),
                 points=c(3, 6, 9, 14, 20, 23, 16, 19, 26))

#view data frame
df

  assist points
1 1 3
2 2 6
3 2 9
4 3 14
5 5 20
6 6 23
7 7 16
8 8 19
9 8 26
ဥပမာ 1- မူရင်းတည်နေရာသို့ စာတန်းတစ်ခုထည့်ပါ။
အောက်ပါကုဒ်သည် gglot2 တွင် scatterplot ဖန်တီးနည်းကိုပြသပြီး မူရင်းတည်နေရာတွင် ဒဏ္ဍာရီတစ်ခုထည့်ပါ (ကွက်ကွက်အောက် ညာဘက်ထောင့်အောက်)
 library (ggplot2)

#create scatter plot with caption in bottom right corner
ggplot(df, aes(x=assists, y=points)) +
  geom_point(size= 3 ) +
  labs(caption = " Based on 2022 Basketball Data ")
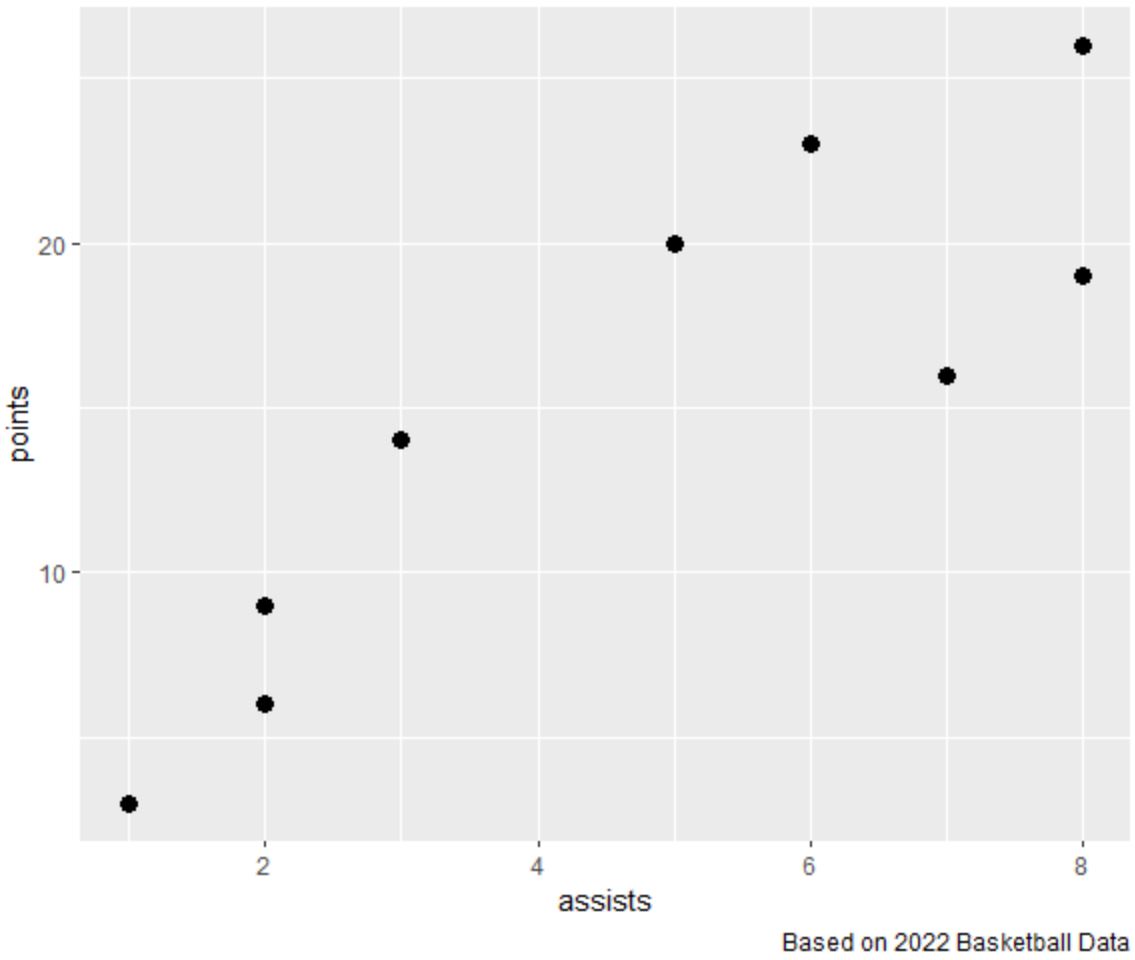
ဇာတ်လမ်း၏ အပြင်ဘက် အောက်ညာဘက်ထောင့်တွင် ဒဏ္ဍာရီတစ်ခုကို ထည့်ထားကြောင်း သတိပြုပါ။
ဥပမာ 2- စိတ်ကြိုက်တည်နေရာတစ်ခုသို့ စာတန်းတစ်ခုထည့်ပါ။
အောက်ဖော်ပြပါကုဒ်သည် gglot2 တွင် scatterplot ဖန်တီးနည်းကို ပြသပြီး ဇာတ်ကွက်အောက်တွင် ဘယ်ဘက်အောက်ထောင့်ရှိ ဒဏ္ဍာရီတစ်ခုကို ထည့်ပါ-
 library (ggplot2)

#create scatter plot with caption in bottom left corner
ggplot(df, aes(x=assists, y=points)) +
  geom_point(size= 3 ) +
  labs(caption = “ Based on 2022 Basketball Data ”) +
  theme(plot. caption = element_text(hjust= 0 ))
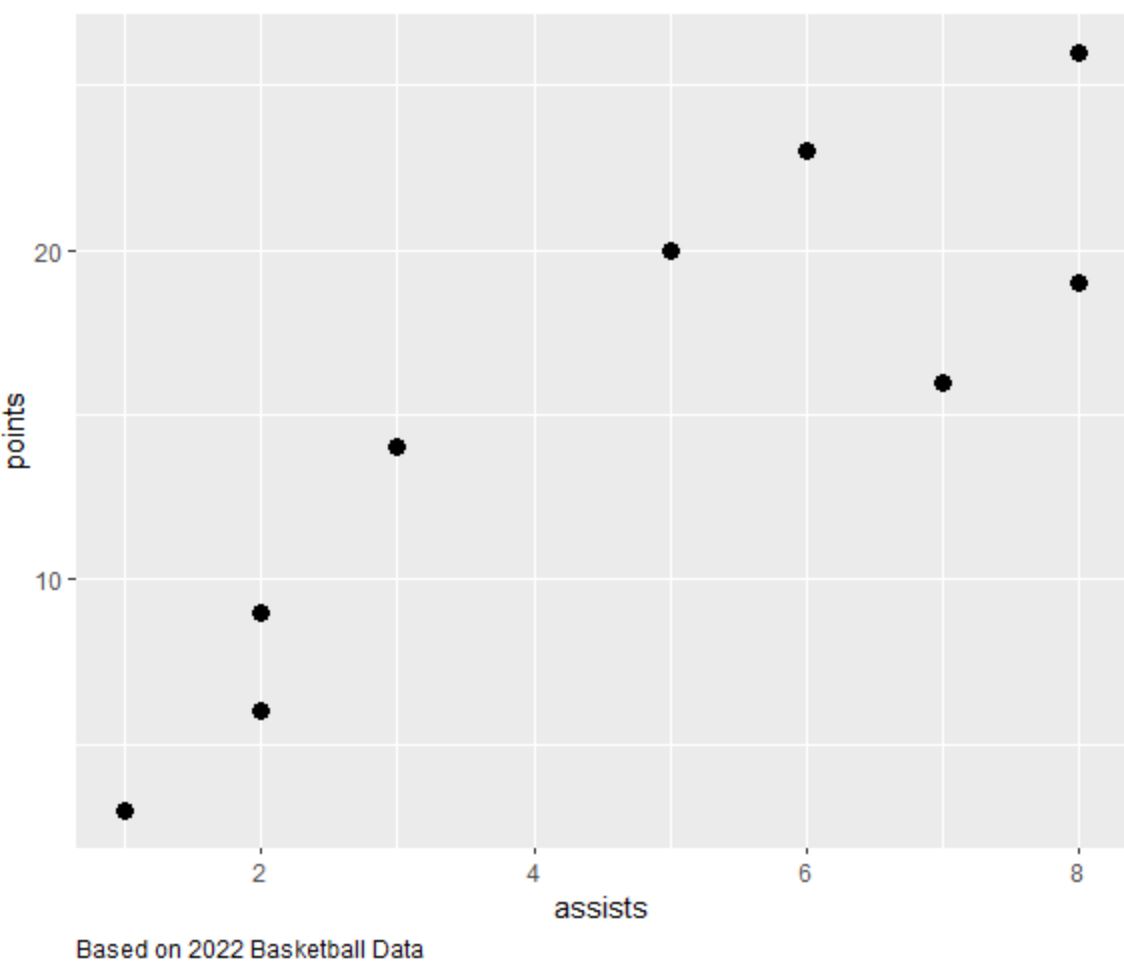
ဇာတ်လမ်း၏ အပြင်ဘက် အောက်ဘယ်ဘက်ထောင့်တွင် ဒဏ္ဍာရီတစ်ခုကို ထည့်ထားကြောင်း သတိပြုပါ။
မှတ်ချက် – ဇာတ်လမ်း၏အပြင်ဘက်အောက်ခြေအလယ်ဗဟိုတွင် ဒဏ္ဍာရီကို hjust=0.5 သတ်မှတ်နိုင်သည်။
ဆက်စပ်- ggplot2 ရှိ အစိတ်အပိုင်းများကို ရွှေ့ရန် hjust & vjust ကို အသုံးပြုနည်း
ဥပမာ 3- စာတန်းတစ်ခုထည့်ကာ စာသားကို စိတ်ကြိုက်ပြင်ဆင်ပါ။
အောက်ပါကုဒ်သည် gglot2 တွင် scatterplot ဖန်တီးနည်းကိုပြသပြီး စိတ်ကြိုက်အရောင်၊ ဖောင့်အရွယ်အစားနှင့် စတိုင်လ်ဖြင့် ဒဏ္ဍာရီတစ်ခုထည့်သည်-
 library (ggplot2)

#create scatter plot with custom caption in bottom right corner
ggplot(df, aes(x=assists, y=points)) +
  geom_point(size= 3 ) +
  labs(caption = “ Based on 2022 Basketball Data ”) +
  theme(plot. caption = element_text(size= 16 , color=" red ", face=" italic "))
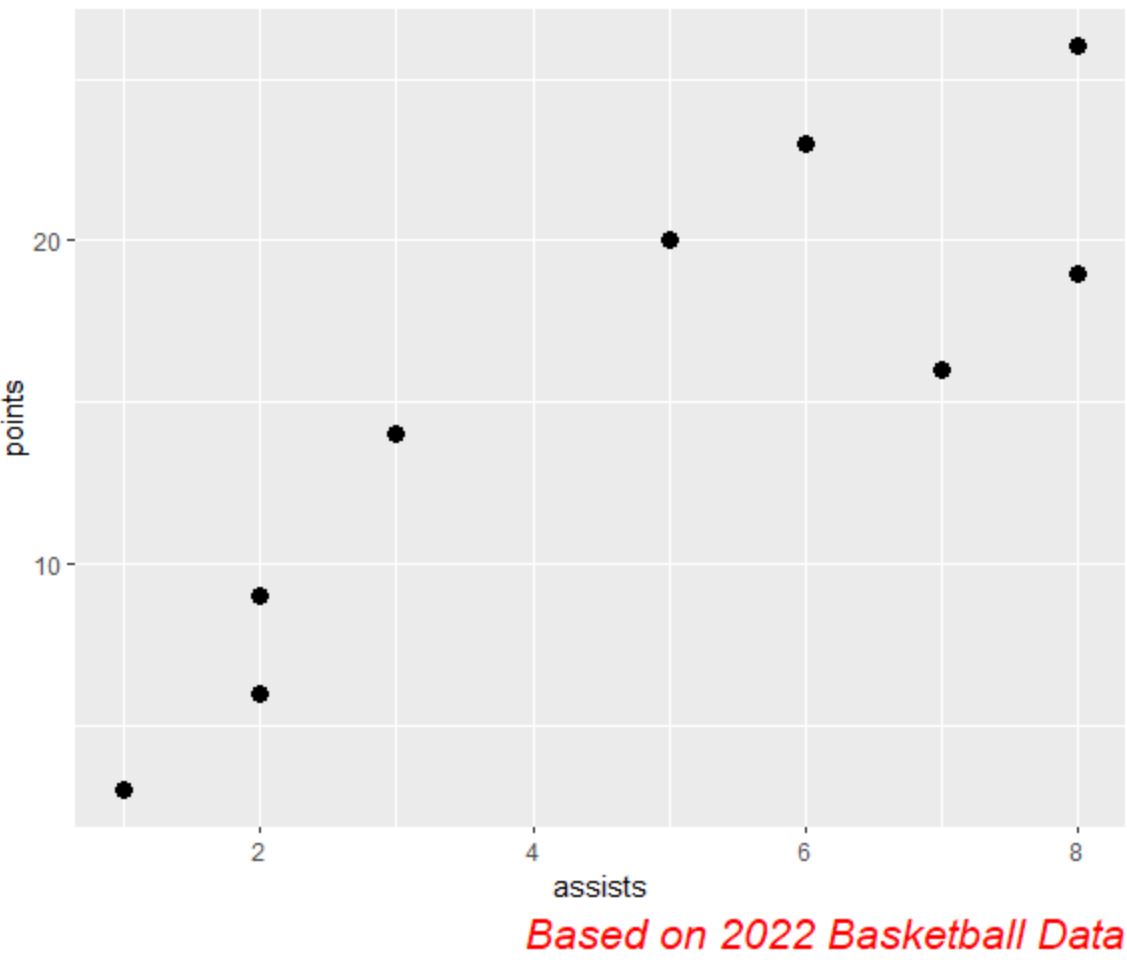
စိတ်ကြိုက်အရောင်၊ ဖောင့်အရွယ်အစားနှင့် စတိုင်လ်တို့နှင့်အတူ ဇာတ်ကွက်အပြင်ဘက် ညာဘက်အောက်ထောင့်တွင် ဒဏ္ဍာရီတစ်ခုကို ထည့်သွင်းထားကြောင်း သတိပြုပါ။
ထပ်လောင်းအရင်းအမြစ်များ
အောက်ဖော်ပြပါ သင်ခန်းစာများသည် ggplot2 တွင် အခြားဘုံအလုပ်များကို မည်သို့လုပ်ဆောင်ရမည်ကို ရှင်းပြသည်-
ggplot2 မှာ ဖောင့်အရွယ်အစားကို ဘယ်လိုပြောင်းမလဲ။
ggplot2 တွင်ဒဏ္ဍာရီကိုမည်သို့ဖယ်ရှားနည်း
ggplot2 တွင် ဝင်ရိုးတံဆိပ်များကို လှည့်နည်း
စာရေးသူအကြောင်း
Benjamin Anderson
မင်္ဂလာပါ၊ ကျွန်ုပ်သည် အငြိမ်းစား စာရင်းအင်း ပါမောက္ခ ဘင်ဂျမင်ဖြစ်ပြီး သီးသန့် Statorials ဆရာအဖြစ် လှည့်ပတ်ပါသည်။ စာရင်းဇယားနယ်ပယ်တွင် ကျယ်ပြန့်သောအတွေ့အကြုံနှင့် ကျွမ်းကျင်မှုနှင့်အတူ၊ Statorials မှတစ်ဆင့် ကျောင်းသားများကို ခွန်အားဖြစ်စေရန်အတွက် ကျွန်ုပ်၏အသိပညာကို မျှဝေလိုပါသည်။ ပိုသိတယ်။