Ggplot2 တွင် မြှားဆွဲနည်း (ဥပမာများနှင့်အတူ)
ggplot2 တွင် ကွက်ကွက်တစ်ခုတွင် မြှားတစ်ခုဆွဲရန် အောက်ပါအခြေခံအထားအသိုကိုသုံးနိုင်သည်။
 library (ggplot2)

ggplot(df, aes(x=x, y=y)) +
  geom_point() +
  geom_segment(aes(x= 5 , y= 6 , xend= 8 , yend= 9 ), arrow = arrow(length=unit( 0.5 , ' cm ')))
ဤသည်မှာ geom_segment() function တွင် argument တစ်ခုစီ လုပ်ဆောင်သည်-
- x : စတင်ရန် x တန်ဖိုး
- y : စတင်ရန် y တန်ဖိုး
- xend : တွင်အဆုံးသတ်ရန် x တန်ဖိုး
- yend : အဆုံးသတ်ရန် y တန်ဖိုး
- arrow : မြှားထိပ်ဖျား၏ အရှည်
အောက်ဖော်ပြပါ ဥပမာသည် လက်တွေ့တွင် ggplot2 ကို အသုံးပြု၍ မြှားဆွဲနည်းကို ပြသထားသည်။
ဥပမာ- ggplot2 တွင် မြှားများဆွဲခြင်း။
ကျွန်ုပ်တို့တွင် ဘတ်စကတ်ဘောကစားသမားအမျိုးမျိုးမှ စုဆောင်းရရှိသည့် အမှတ်အရေအတွက်နှင့် ပြန်ပြန်အထွက်များဆိုင်ရာ အချက်အလက်များပါဝင်သော အောက်ပါဒေတာဘေ့စ်တွင် ဆိုပါစို့။
 #create data frame
df <- data. frame (points=c(3, 3, 5, 6, 7, 8, 9, 9, 8, 5),
                 rebounds=c(2, 6, 5, 5, 8, 5, 9, 9, 8, 6))

#view data frame
df

   rebound points
1 3 2
2 3 6
3 5 5
4 6 5
5 7 8
6 8 5
7 9 9
8 9 9
9 8 8
10 5 6
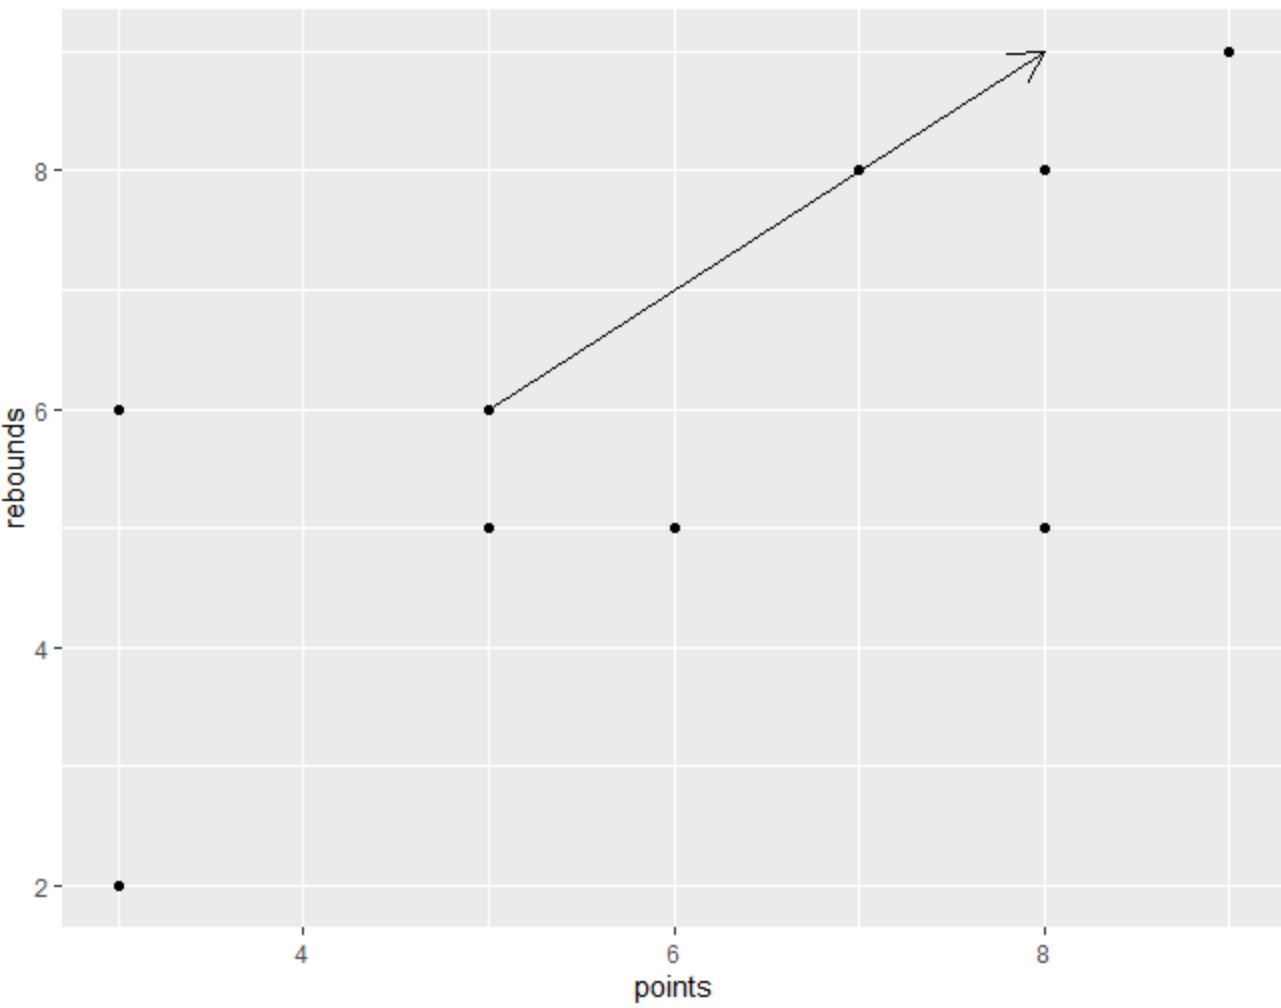
ggplot2 တွင် scatterplot တစ်ခုဖန်တီးရန် အောက်ဖော်ပြပါ syntax ကိုသုံးနိုင်ပြီး ကွက်လပ်ရှိ သီးခြားတည်နေရာတစ်ခုတွင် မြှားတစ်ခုထည့်နိုင်သည်။
 library (ggplot2)

#create scatterplot and add arrow
ggplot(df, aes(x=points, y=rebounds)) +
  geom_point() +
  geom_segment(aes(x= 5 , y= 6 , xend= 8 , yend= 9 ), arrow = arrow(length=unit( .5 , ' cm ')))
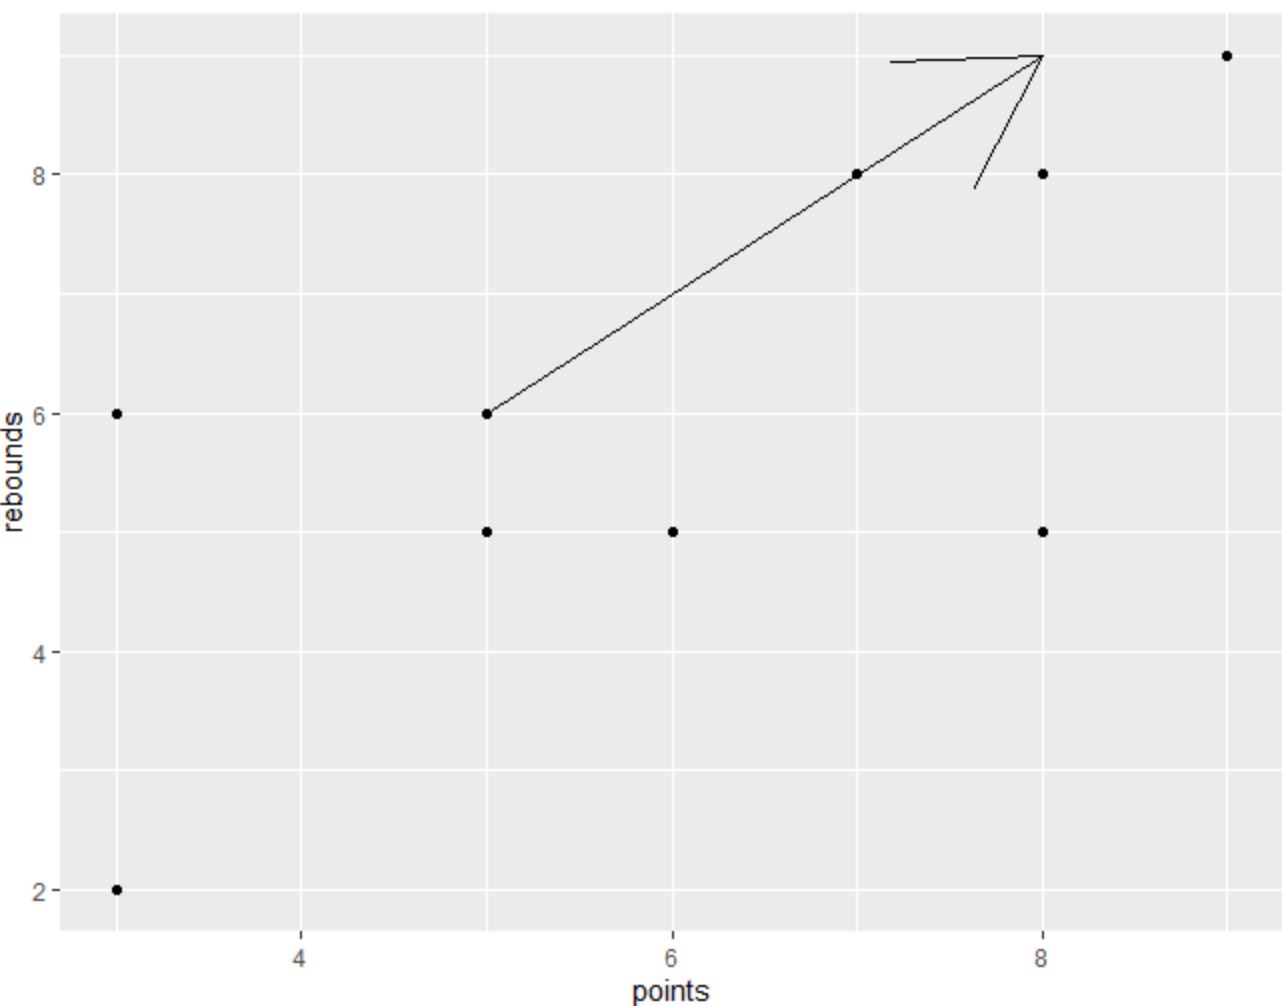
မြှားခေါင်း၏အရွယ်အစားကို တိုးမြှင့်ရန် သို့မဟုတ် လျှော့ချရန်အတွက် မြှားခေါင်း() လုပ်ဆောင်ချက်ရှိ တန်ဖိုးကို လွတ်လပ်စွာပြောင်းလဲနိုင်သည်။
ဥပမာအားဖြင့်၊ အောက်ပါကုဒ်သည် အရွယ်အစားကို မည်ကဲ့သို့ တိုးမြှင့်ရမည်ကို ပြသသည်-
 library (ggplot2)

#create scatterplot and add arrow with increased arrow head size
ggplot(df, aes(x=points, y=rebounds)) +
  geom_point() +
  geom_segment(aes(x= 5 , y= 6 , xend= 8 , yend= 9 ), arrow = arrow(length=unit( 2 , ' cm ')))
မြှား၏အရောင်နှင့် မျဉ်းအကျယ်ကို အသီးသီးပြောင်းလဲရန် အရောင် နှင့် lwd အငြင်းအခုံများကို သင်အသုံးပြုနိုင်သည်။
 library (ggplot2)

#create scatterplot and add customized arrow
ggplot(df, aes(x=points, y=rebounds)) +
  geom_point() +
  geom_segment(aes(x= 5 , y= 6 , xend= 8 , yend= 9 ), arrow = arrow(length=unit( .5 , ' cm ')),
               color=' red ', lwd= 3 )
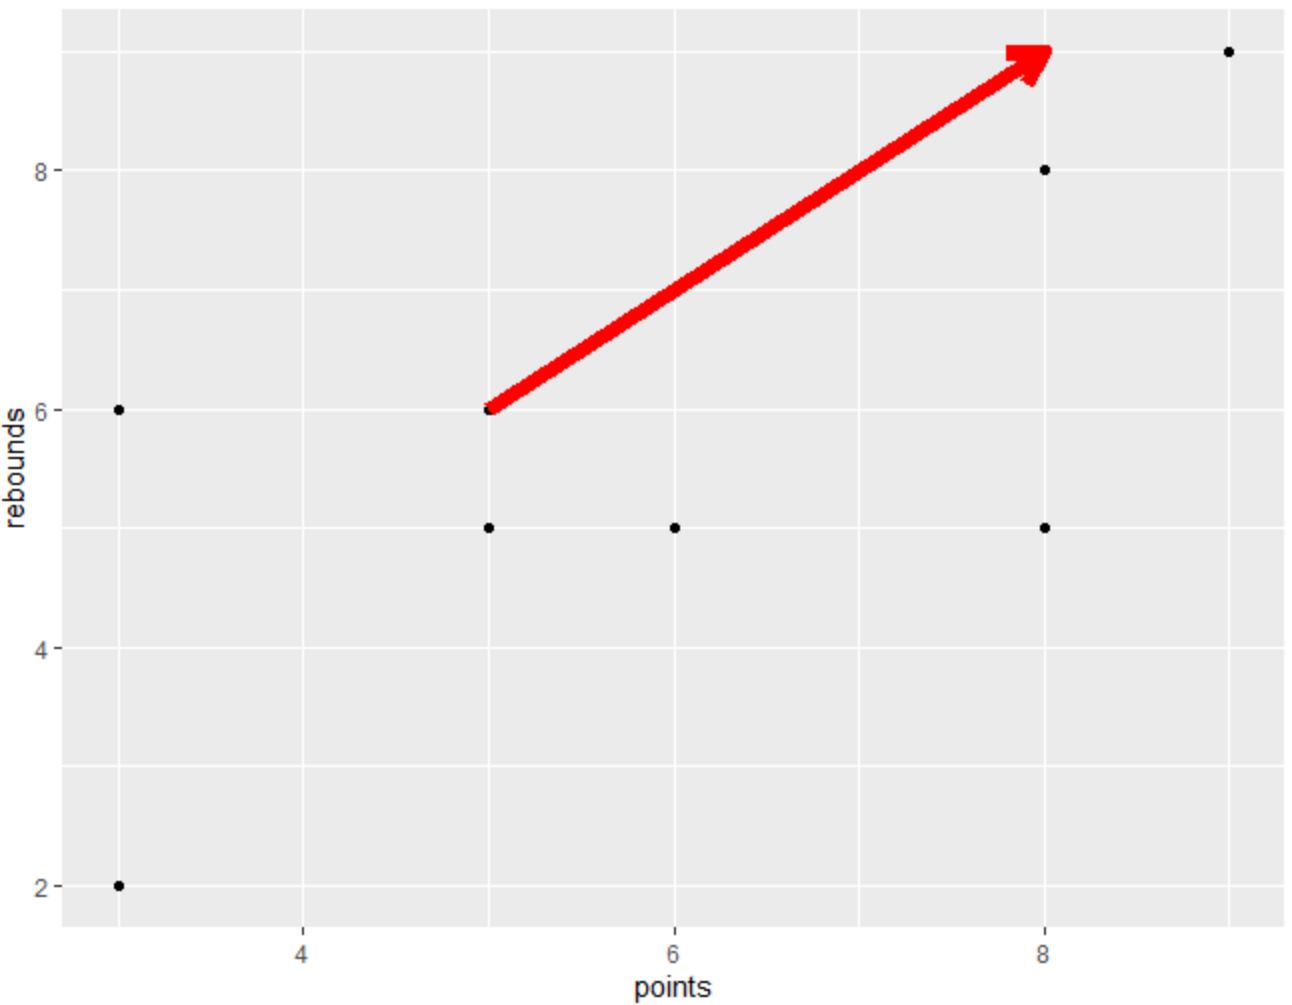
သင်လိုချင်သည့်ပုံစံနှင့်တူသောမြှားကိုဖန်တီးရန် geom_segment() လုပ်ဆောင်ချက်၏ မတူညီသော အကြောင်းပြချက်များဖြင့် လွတ်လပ်စွာကစားပါ။
ထပ်လောင်းအရင်းအမြစ်များ
အောက်ဖော်ပြပါ သင်ခန်းစာများသည် ggplot2 တွင် အခြားဘုံအလုပ်များကို မည်သို့လုပ်ဆောင်ရမည်ကို ရှင်းပြသည်-
ggplot2 တွင် gridline များကိုမည်သို့ဖယ်ရှားနည်း
ggplot2 တွင် ဧရိယာကို အရိပ်လုပ်နည်း
ggplot2 တွင် X ဝင်ရိုးအညွှန်းများကိုဘယ်လိုပြောင်းမလဲ။
စာရေးသူအကြောင်း
Benjamin Anderson
မင်္ဂလာပါ၊ ကျွန်ုပ်သည် အငြိမ်းစား စာရင်းအင်း ပါမောက္ခ ဘင်ဂျမင်ဖြစ်ပြီး သီးသန့် Statorials ဆရာအဖြစ် လှည့်ပတ်ပါသည်။ စာရင်းဇယားနယ်ပယ်တွင် ကျယ်ပြန့်သောအတွေ့အကြုံနှင့် ကျွမ်းကျင်မှုနှင့်အတူ၊ Statorials မှတစ်ဆင့် ကျောင်းသားများကို ခွန်အားဖြစ်စေရန်အတွက် ကျွန်ုပ်၏အသိပညာကို မျှဝေလိုပါသည်။ ပိုသိတယ်။