Ggplot2 တွင် လိုင်းအထူကို ချိန်ညှိနည်း
ggplot2 တွင် စာကြောင်းတစ်ကြောင်း၏ အထူကို ချိန်ညှိရန် အရွယ်အစား အငြင်းအခုံကို အသုံးပြုနိုင်သည်။
 ggplot(df, aes (x = x, y = y)) +
  geom_line(size = 1.5 )
အရွယ်အစားသည် ပုံသေ 1 သို့ သတ်မှတ်သည်၊ သို့သော် သင်ချိန်ညှိလိုသော အထူရှိသော မည်သည့် ဒဿမတန်ဖိုးကိုမဆို သတ်မှတ်နိုင်သည်။
ဤသင်ခန်းစာသည် လက်တွေ့တွင် မျဉ်းအလေးချိန်ကို ချိန်ညှိနည်းကို ဥပမာပေးထားသည်။
ဥပမာ- ggplot2 တွင် လိုင်းအထူကို ချိန်ညှိပါ။
အောက်ဖော်ပြပါကုဒ်သည် ggplot2 ကိုအသုံးပြု၍ ရိုးရှင်းသောမျဉ်းကွက်တစ်ခုဖန်တီးနည်းကိုပြသသည်-
 #load ggplot2 visualization package
library (ggplot2)

#create data
df <- data. frame (x=c(1, 2, 3, 4, 5, 6, 7),
                 y=c(6, 8, 12, 14, 11, 10, 15))

#create line plot
ggplot(df, aes (x = x, y = y)) +
  geom_line()
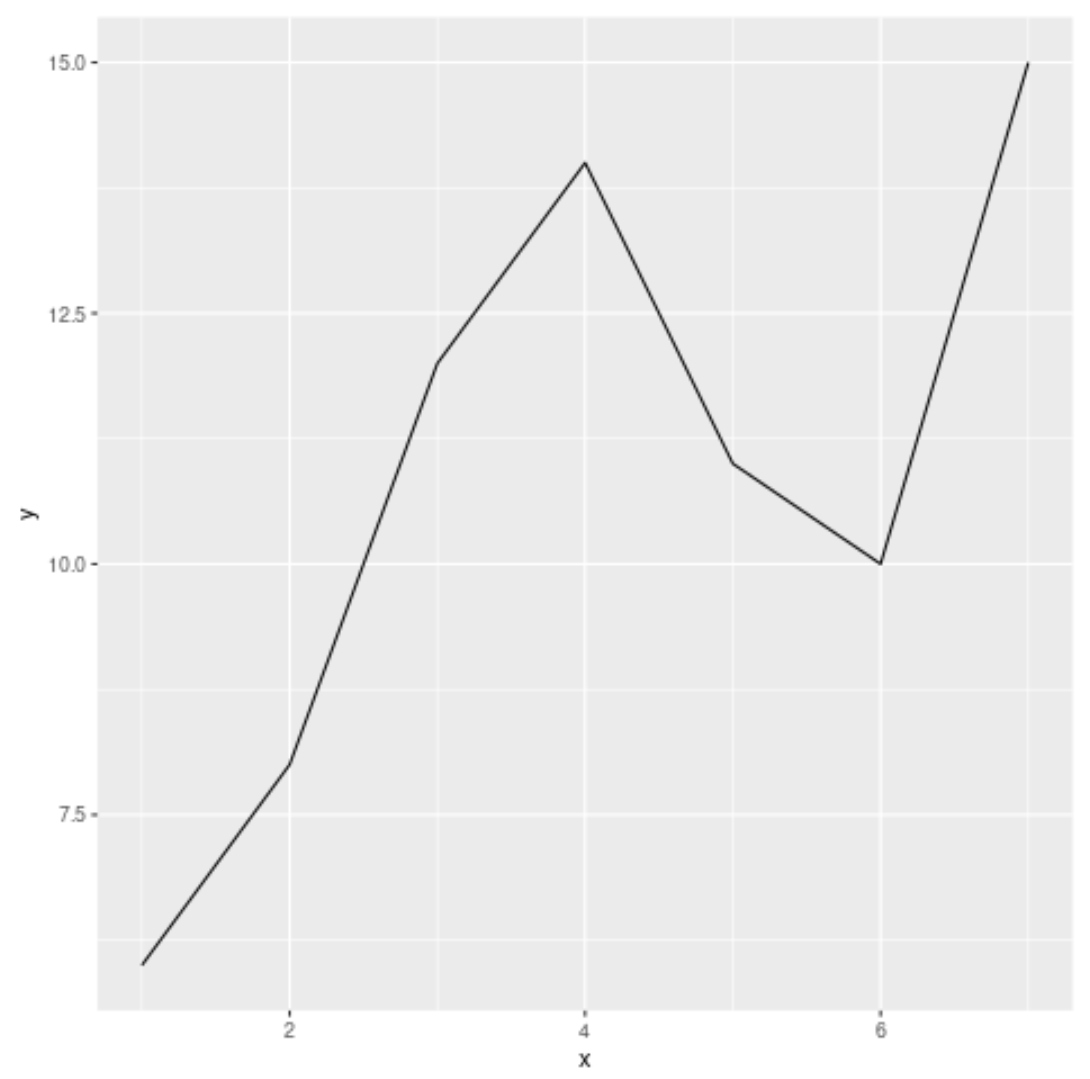
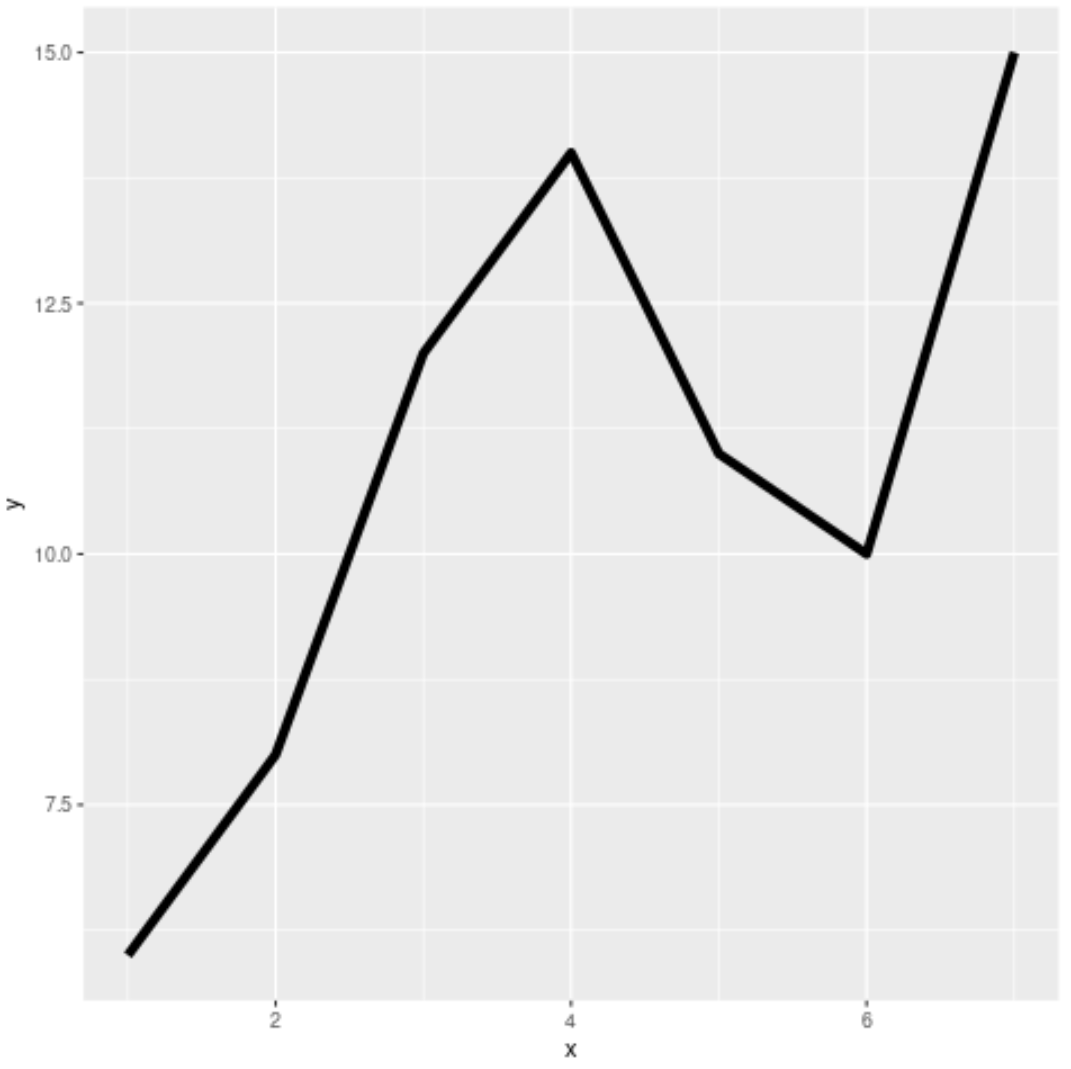
ပုံမှန်အားဖြင့်၊ မျဉ်းအထူသည် 1 နှင့် ညီသော်လည်း အရွယ်အစား အငြင်းအခုံကို အသုံးပြု၍ တိုးနိုင်သည်။
 library (ggplot2)

#create line plot
ggplot(df, aes (x = x, y = y)) +
  geom_line(size = 2 )
အောက်ပါကုဒ်သည် လိုင်းအလေးချိန်အတွက် မတူညီသောအရွယ်အစားများကို အသုံးပြု၍ မတူညီသော မျဉ်းကွက်များကို ပြသသည်-
 library (ggplot2)
library (gridExtra)

#create data
df <- data. frame (x=c(1, 2, 3, 4, 5, 6, 7),
                 y=c(6, 8, 12, 14, 11, 10, 15))

#create four line plots
plot1 <- ggplot(df, aes (x=x,y=y)) + geom_line() + ggtitle(" Size = 1 (Default) ")
plot2 <- ggplot(df, aes (x=x,y=y)) + geom_line(size= 1.5 ) + ggtitle(" Size = 1.5 ")
plot3 <- ggplot(df, aes (x=x,y=y)) + geom_line(size= 2 ) + ggtitle(" Size = 2 ")
plot4 <- ggplot(df, aes (x=x,y=y)) + geom_line(size= 3 ) + ggtitle(" Size = 3 ")

#display all line plots stacked on top of each other
grid. arrange (plot1, plot2, plot3, plot4, ncol=1)
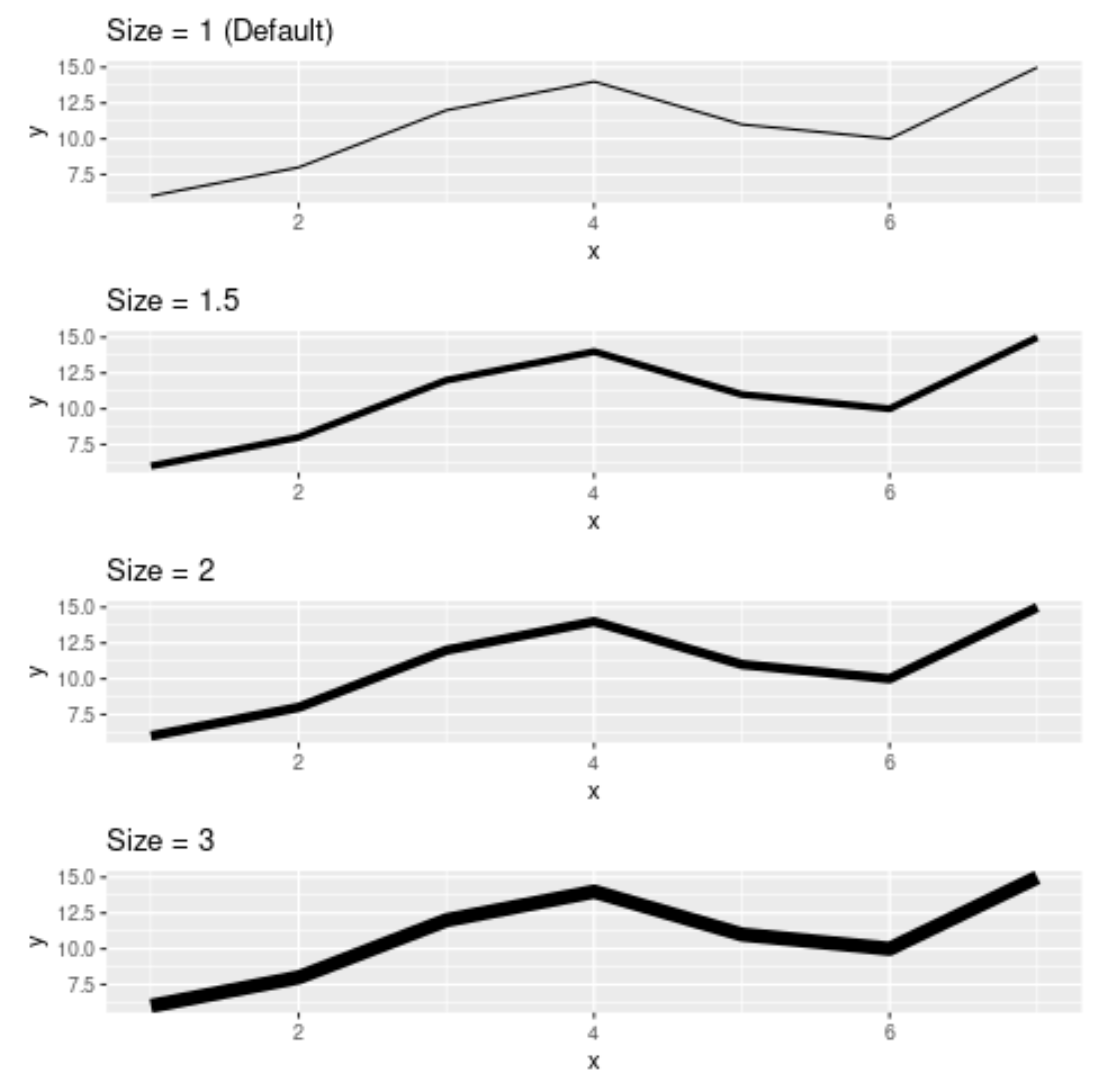
အရွယ်အစား အငြင်းအခုံတွင် ပေးထားသော တန်ဖိုးပိုကြီးလေ၊ မျဉ်းသည် ကွက်ကွက်ထဲတွင် ပိုထူလာမည်ဖြစ်သည်။
နောက်ထပ် R သင်ခန်းစာများကို ဤနေရာတွင် ရှာပါ။
စာရေးသူအကြောင်း
Benjamin Anderson
မင်္ဂလာပါ၊ ကျွန်ုပ်သည် အငြိမ်းစား စာရင်းအင်း ပါမောက္ခ ဘင်ဂျမင်ဖြစ်ပြီး သီးသန့် Statorials ဆရာအဖြစ် လှည့်ပတ်ပါသည်။ စာရင်းဇယားနယ်ပယ်တွင် ကျယ်ပြန့်သောအတွေ့အကြုံနှင့် ကျွမ်းကျင်မှုနှင့်အတူ၊ Statorials မှတစ်ဆင့် ကျောင်းသားများကို ခွန်အားဖြစ်စေရန်အတွက် ကျွန်ုပ်၏အသိပညာကို မျှဝေလိုပါသည်။ ပိုသိတယ်။