Ggplot2 တွင် အညွှန်းများထည့်နည်း
ggplot2 ရှိ histogram တွင် အညွှန်းများထည့်ရန် အောက်ပါအခြေခံ syntax ကိုသုံးနိုင်သည်။
 ggplot(data=df, aes(x=values_var)) +
  geom_histogram(aes(fill=group_var), binwidth= 1 , color=' black ') +
  stat_bin(binwidth= 1 , geom=' text ', color=' white ', size= 4 ,
           aes(label=..count.., group=group_var), position=position_stack(vjust= 0.5 ))
ဤဥပမာသည် histogram အမျိုးအစားတစ်ခုစီရှိ ဘင်တစ်ခုစီ၏ရေတွက်မှုကိုပြသရန် အဖြူရောင်အညွှန်းတစ်ခုကို ပေါင်းထည့်သည်။
အောက်ဖော်ပြပါ ဥပမာသည် ဤ syntax ကို လက်တွေ့တွင် မည်သို့အသုံးပြုရမည်ကို ပြသထားသည်။
ဥပမာ- ggplot2 တွင် အညွှန်းများကို histogram သို့ထည့်ပါ။
ကျွန်ုပ်တို့တွင် မတူညီသောအသင်းသုံးသင်းမှ ဘတ်စကက်ဘောကစားသမားများမှ ရမှတ်များအကြောင်း အချက်အလက်ပါရှိသော R တွင် အောက်ပါဒေတာဘောင်ရှိသည်ဆိုပါစို့။
 #make this example reproducible
set. seeds (1)

#create data frame
df <- data. frame (team=rep(c(' A ', ' B ', ' C '), each=100),
                 points=c(runif(100, 5, 10),
                          runif(100, 5, 10),
                          runif(100, 5, 10)))

#view head of data frame
head(df)

  team points
1 A 6.327543
2 A 6.860619
3 A 7.864267
4 A 9.541039
5 A 6.008410
6 A 9.491948
bin တစ်ခုစီအတွက် ပမာဏကို ညွှန်ပြသော အညွှန်းများပါသော အသင်းတစ်ခုစီရှိ ကစားသမားများမှ ရမှတ်များကို ပြသသည့် ဟီစတိုဂရမ်ကို ဖန်တီးရန် အောက်ပါကုဒ်ကို အသုံးပြုနိုင်ပါသည်။
 library (ggplot2)

#create histogram with labels for each bin
ggplot(data=df, aes(x=points)) +
  geom_histogram(aes(fill=team), binwidth= 1 , color=' black ') +
  stat_bin(binwidth= 1 , geom=' text ', color=' white ', size= 4 ,
           aes(label=..count.., group=team), position=position_stack(vjust= 0.5 ))
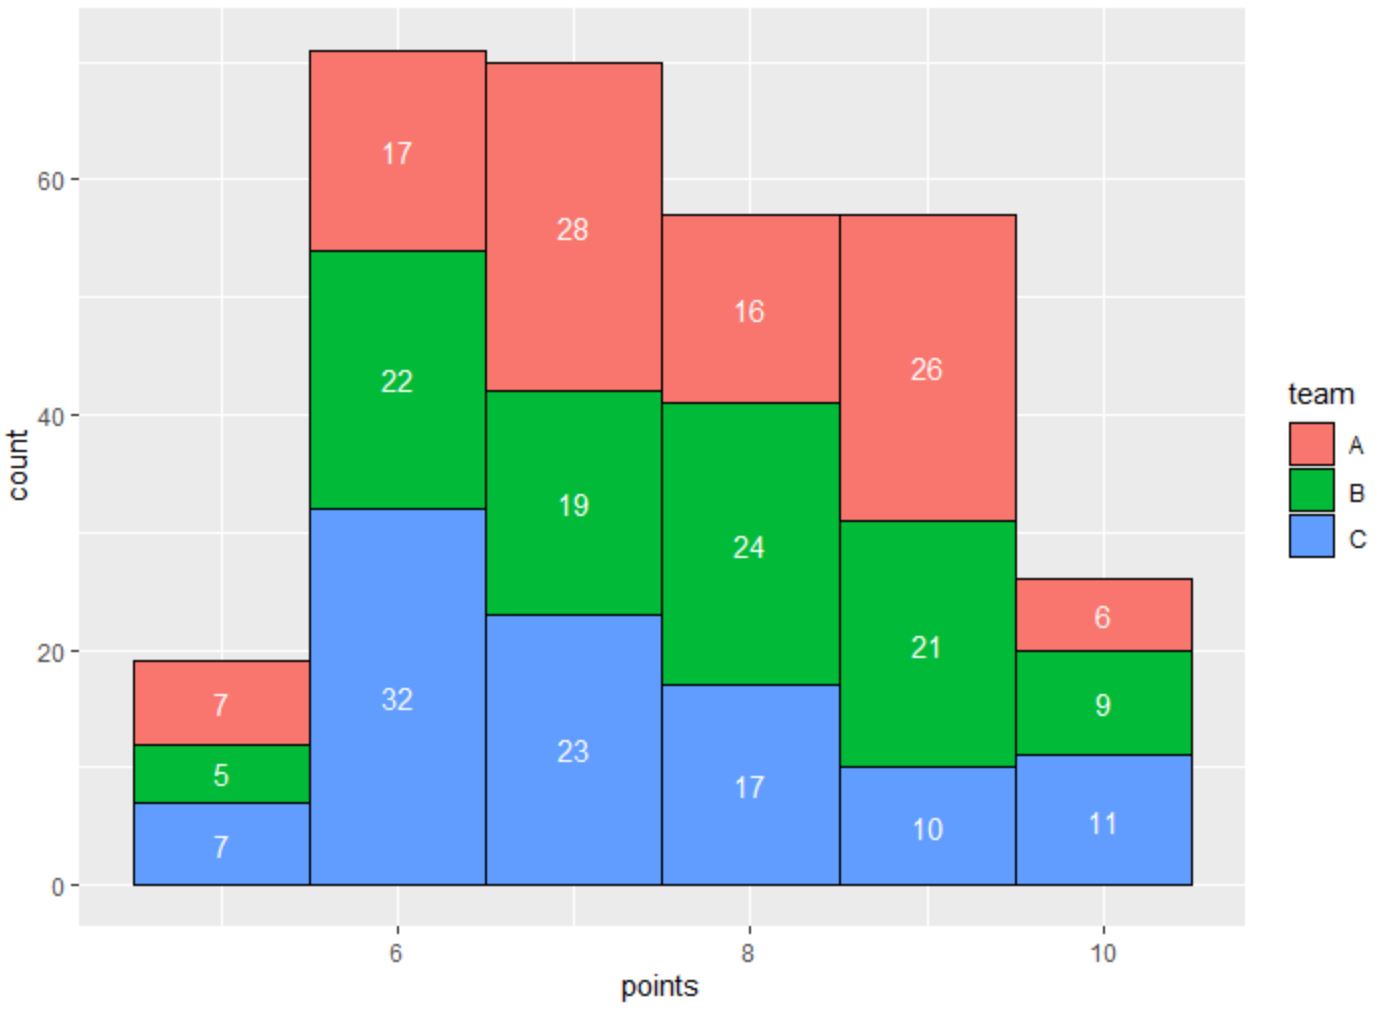
ဘင်တစ်ခုစီတွင် ဘင်တစ်ခုစီ၏ အရေအတွက်ကို ဖော်ပြသည့် အညွှန်းတစ်ခုပါရှိကြောင်း သတိပြုပါ။
တံဆိပ်များ၏ အရောင် နှင့် အရွယ်အစား တို့ကို အသီးသီးပြောင်းလဲရန် stat_bin() လုပ်ဆောင်ချက်ရှိ အရောင်နှင့် အရွယ်အစားတန်ဖိုးများကို ပြောင်းလဲနိုင်သည်ကို သတိပြုပါ။
ဥပမာအားဖြင့်၊ ဖောင့်အရွယ်အစား တိုးလာသော အနက်ရောင် အညွှန်းများကို အသုံးပြုရန် အောက်ပါ syntax ကို အသုံးပြုနိုင်ပါသည်။
 library (ggplot2)

#create histogram with labels for each bin
ggplot(data=df, aes(x=points)) +
  geom_histogram(aes(fill=team), binwidth= 1 , color=' black ') +
  stat_bin(binwidth= 1 , geom=' text ', color=' black ', size= 6 ,
           aes(label=..count.., group=team), position=position_stack(vjust= 0.5 ))
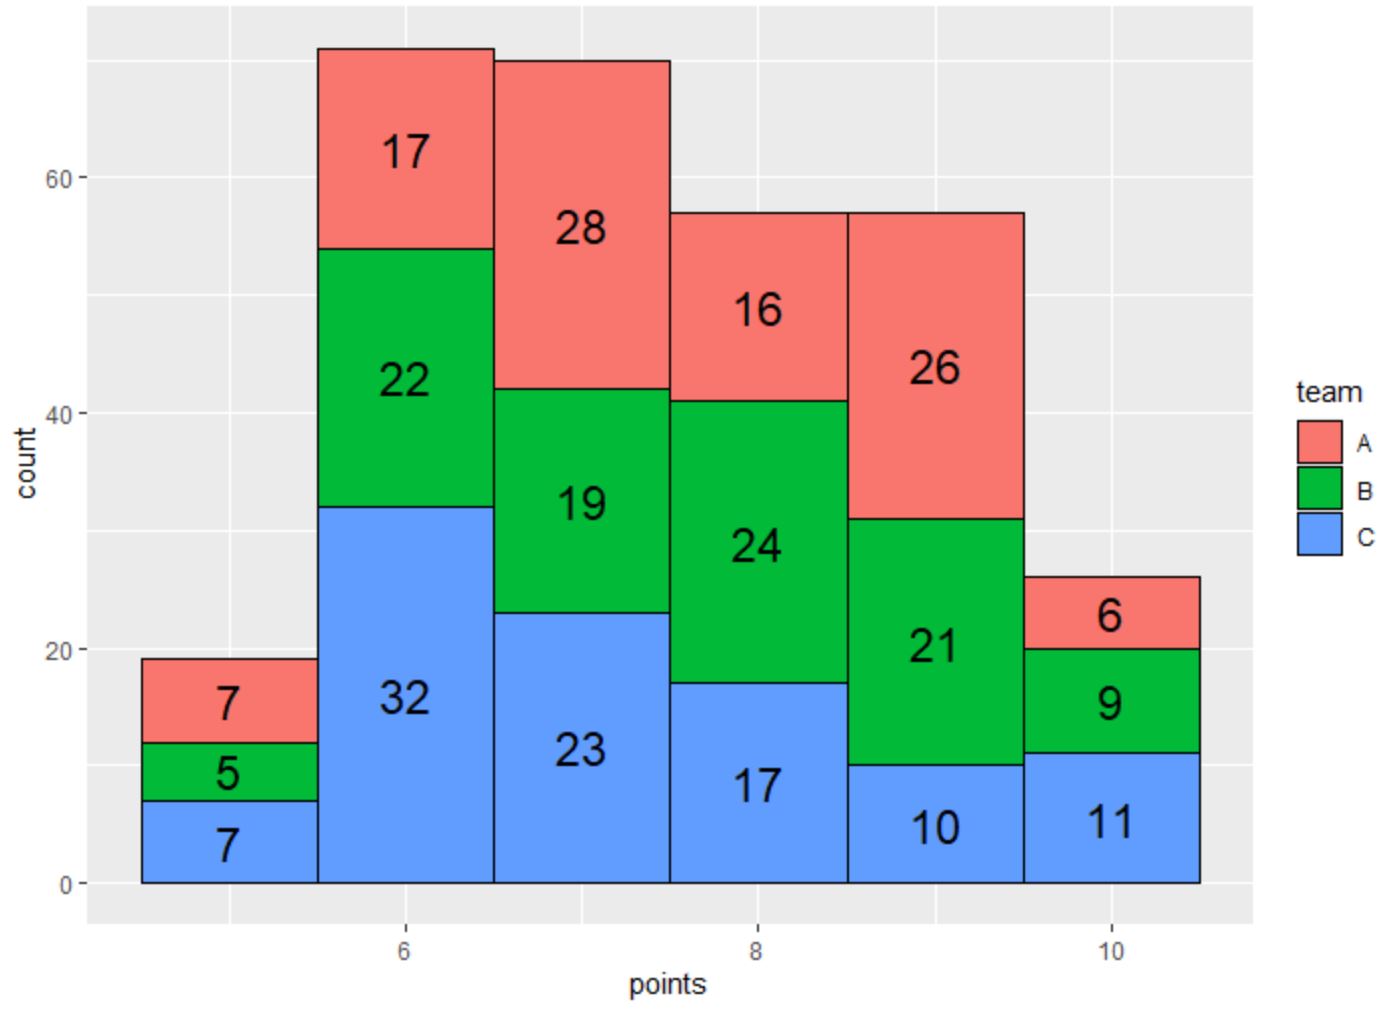
ဘင်တစ်ခုစီအတွက် အညွှန်းများသည် အနက်ရောင်စာသားနှင့် ပိုကြီးသော ဖောင့်အရွယ်အစားကို အသုံးပြုနေပြီဖြစ်သည်။
အညွှန်းများကို သင်လိုချင်သည့်ပုံစံအတိုင်း ပေါ်လာစေရန် stat_bin() လုပ်ဆောင်ချက်ရှိ အရောင် နှင့် အရွယ်အစား အငြင်းအခုံများဖြင့် ကစားပါ။
ထပ်လောင်းအရင်းအမြစ်များ
အောက်ဖော်ပြပါ သင်ခန်းစာများသည် R တွင် အခြားဘုံအလုပ်များကို မည်သို့လုပ်ဆောင်ရမည်ကို ရှင်းပြသည်-
ggplot2 တွင် အုပ်စုအလိုက် ဟီစတိုဂရမ်များ ဖန်တီးနည်း
ggplot2 တွင် histogram တွင် ရာခိုင်နှုန်းများကို မည်သို့ပြသမည်နည်း။
ggplot2 တွင် histogram တစ်ခုအတွက် bins အရေအတွက်ကို ဘယ်လိုသတ်မှတ်မလဲ။
စာရေးသူအကြောင်း
Benjamin Anderson
မင်္ဂလာပါ၊ ကျွန်ုပ်သည် အငြိမ်းစား စာရင်းအင်း ပါမောက္ခ ဘင်ဂျမင်ဖြစ်ပြီး သီးသန့် Statorials ဆရာအဖြစ် လှည့်ပတ်ပါသည်။ စာရင်းဇယားနယ်ပယ်တွင် ကျယ်ပြန့်သောအတွေ့အကြုံနှင့် ကျွမ်းကျင်မှုနှင့်အတူ၊ Statorials မှတစ်ဆင့် ကျောင်းသားများကို ခွန်အားဖြစ်စေရန်အတွက် ကျွန်ုပ်၏အသိပညာကို မျှဝေလိုပါသည်။ ပိုသိတယ်။