Ggplot2 တွင် ခေါင်းစဉ်ရာထူးကို မည်သို့ပြောင်းနည်း (ဥပမာများဖြင့်)
မူရင်းအားဖြင့်၊ ggplot2 ရှိ ကြံစည်မှုခေါင်းစဉ်များကို ဘယ်သို့ ညှိထားသည်။
သို့သော်၊ သင်သည် ခေါင်းစဉ်၏ အနေအထားကို ပြောင်းလဲရန် အောက်ပါနည်းလမ်းများကို အသုံးပြုနိုင်သည်။
နည်းလမ်း 1- ခေါင်းစဉ်ကို ဗဟိုပြုပါ။
 some_ggplot +
  theme(plot. title = element_text(hjust = 0.5 ))
နည်းလမ်း 2- ခေါင်းစဉ်ကို ညာဘက်သို့ ညှိပါ။
 some_ggplot +
  theme(plot. title = element_text(hjust = 1 ))
နည်းလမ်း 3- ခေါင်းစဉ် အနေအထားကို ဒေါင်လိုက် ချိန်ညှိပါ။
 some_ggplot +
  theme(plot. title = element_text(vjust = 10 ))
အောက်ဖော်ပြပါနမူနာများသည် R တွင်တည်ဆောက်ထားသော mtcars dataset ဖြင့် နည်းလမ်းတစ်ခုစီကို လက်တွေ့တွင်အသုံးပြုနည်းကိုပြသထားသည်။
ဥပမာ 1- ခေါင်းစဉ်ကို ဗဟိုပြုပါ။
အောက်ပါကုဒ်သည် ggplot2 တွင် scatterplot ဖန်တီးနည်းကိုပြသပြီး hjust အငြင်းအခုံကိုအသုံးပြု၍ ခေါင်းစဉ်ကိုဗဟိုပြုသည်-
 library (ggplot2)

#create scatterplot with centered title
ggplot(data=mtcars, aes(x=mpg, y=wt)) +
  geom_point() +
  ggtitle(" Plot Title ") +
  theme(plot. title = element_text(hjust = 0.5 ))
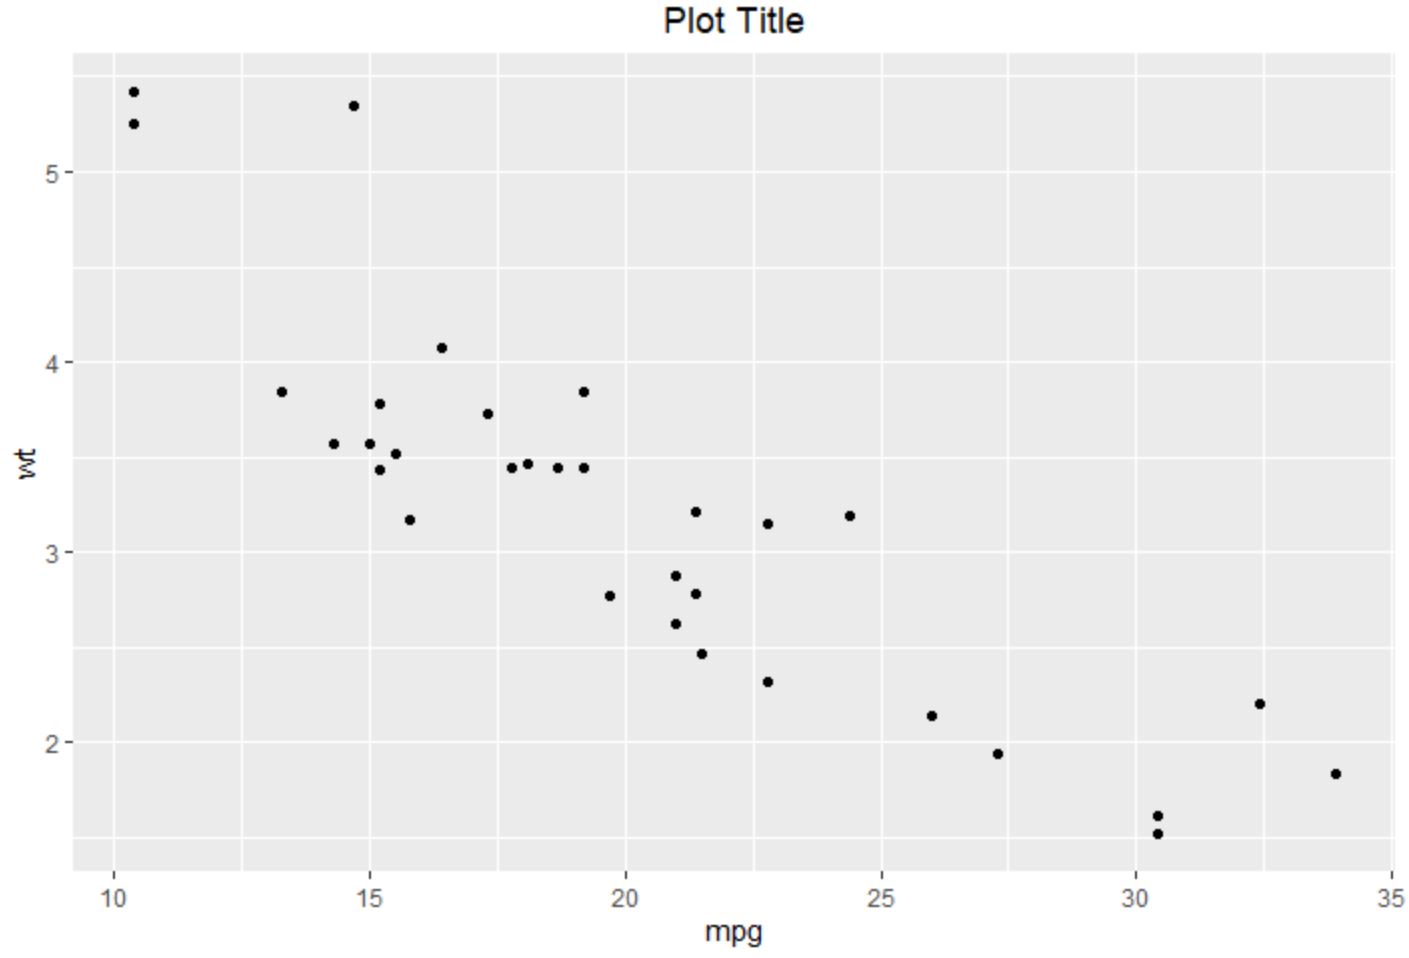
ခေါင်းစဉ်သည် အလယ်တည့်တည့်တွင် ရှိနေကြောင်း သတိပြုပါ။
ဥပမာ 2- ခေါင်းစဉ်ကို ညာဘက်တွင် ညှိပါ။
အောက်ပါကုဒ်သည် ggplot2 တွင် scatterplot ဖန်တီးနည်းကို ပြသပြီး hjust အငြင်းအခုံကို အသုံးပြု၍ ခေါင်းစဉ်ကို ညာဘက်သို့ ညှိပါ။
 library (ggplot2)

#create scatterplot with right-aligned title
ggplot(data=mtcars, aes(x=mpg, y=wt)) +
  geom_point() +
  ggtitle(" Plot Title ") +
  theme(plot. title = element_text(hjust = 1 ))
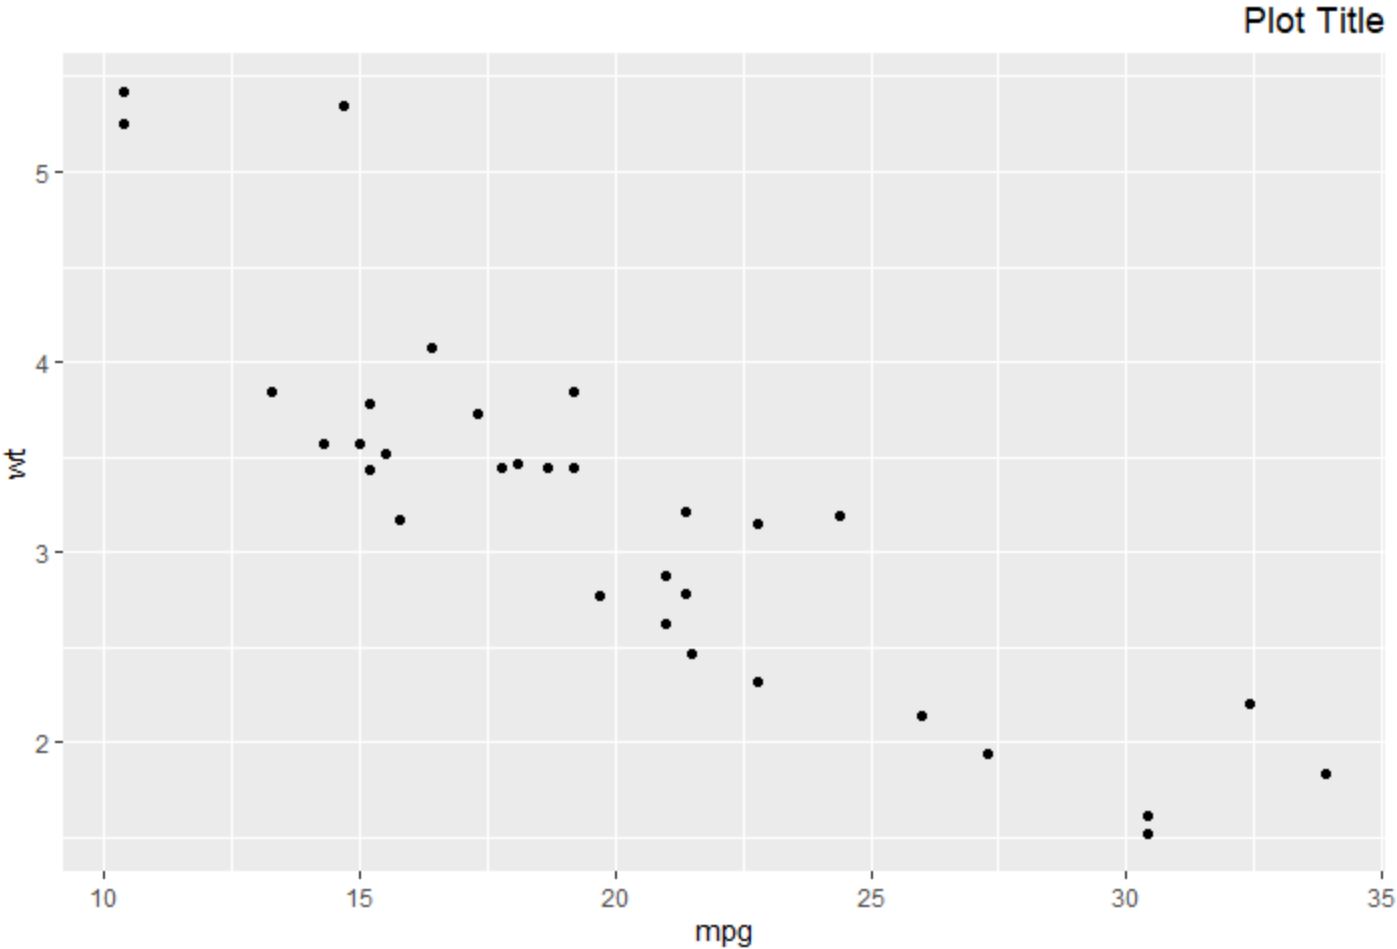
ခေါင်းစဉ်သည် ညာဘက်သို့ ညှိထားကြောင်း သတိပြုပါ။
ဥပမာ 3- ခေါင်းစဉ်အနေအထားကို ဒေါင်လိုက် ချိန်ညှိပါ။
အောက်ပါကုဒ်သည် ggplot2 တွင် scatterplot ဖန်တီးနည်းကိုပြသပြီး vjust အငြင်းအခုံကို အသုံးပြု၍ ခေါင်းစဉ်ကို ပိုမြင့်အောင်ရွှေ့ပါ။
 library (ggplot2)

#create scatterplot with title moved higher up
ggplot(data=mtcars, aes(x=mpg, y=wt)) +
  geom_point() +
  ggtitle(" Plot Title ") +
  theme(plot. title = element_text(hjust = 1 , vjust = 3 ))
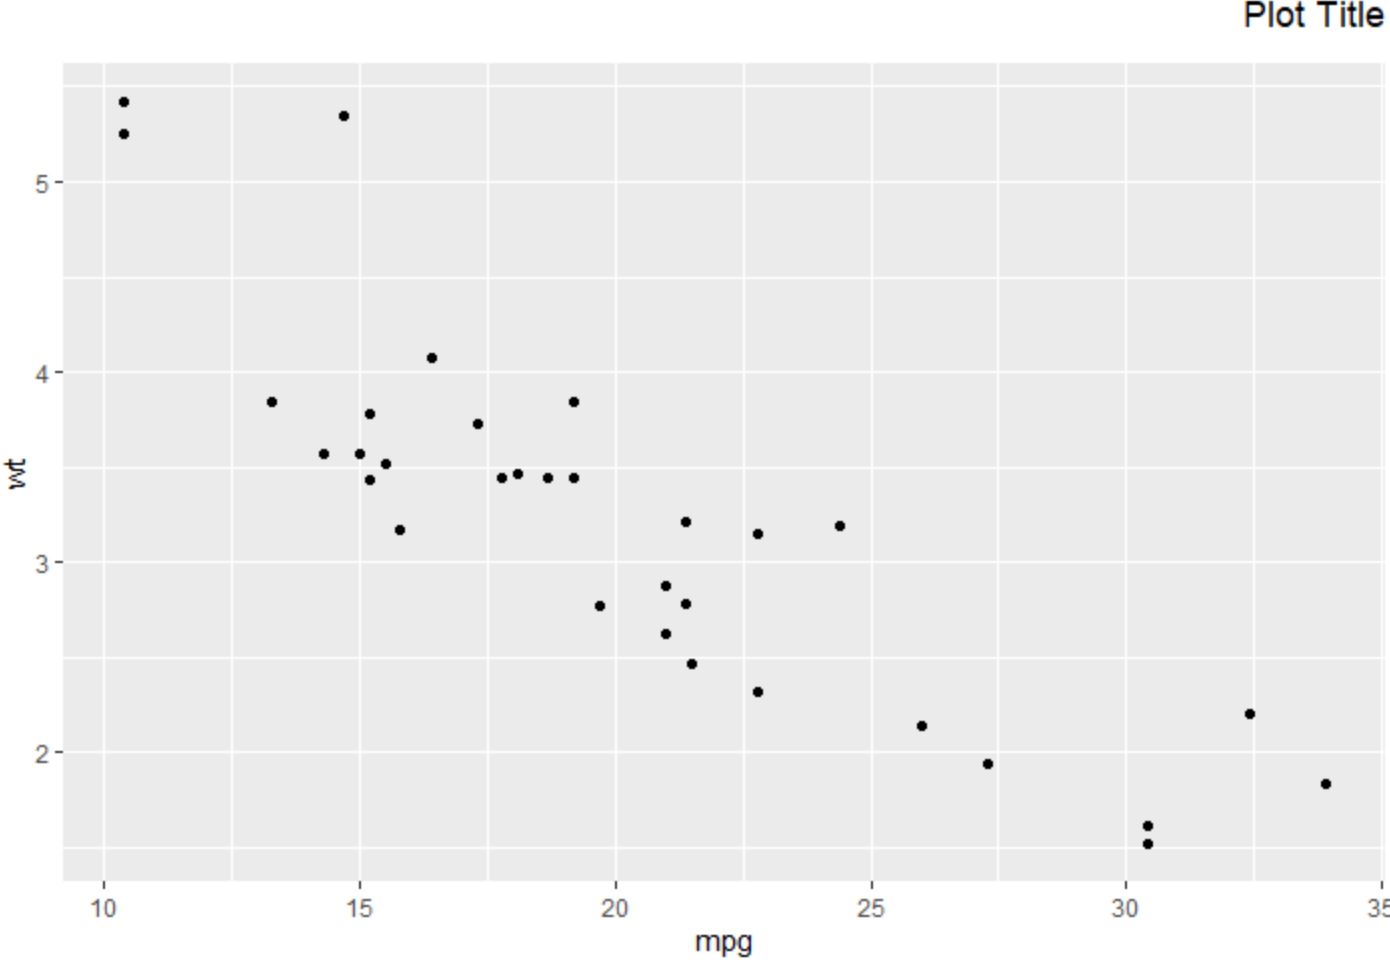
ခေါင်းစဉ်ကို ပိုမြင့်သွားအောင် သတိပြုပါ။
ခေါင်းစဉ်ကို အောက်သို့ရွှေ့ရန် vjust အငြင်းအခုံသို့ အနုတ်တန်ဖိုးကိုလည်း ပေးနိုင်သည်။
 library (ggplot2)

#create scatterplot with title moved down
ggplot(data=mtcars, aes(x=mpg, y=wt)) +
  geom_point() +
  ggtitle(" Plot Title ") +
  theme(plot. title = element_text(hjust = 1 , vjust = - 10 ))
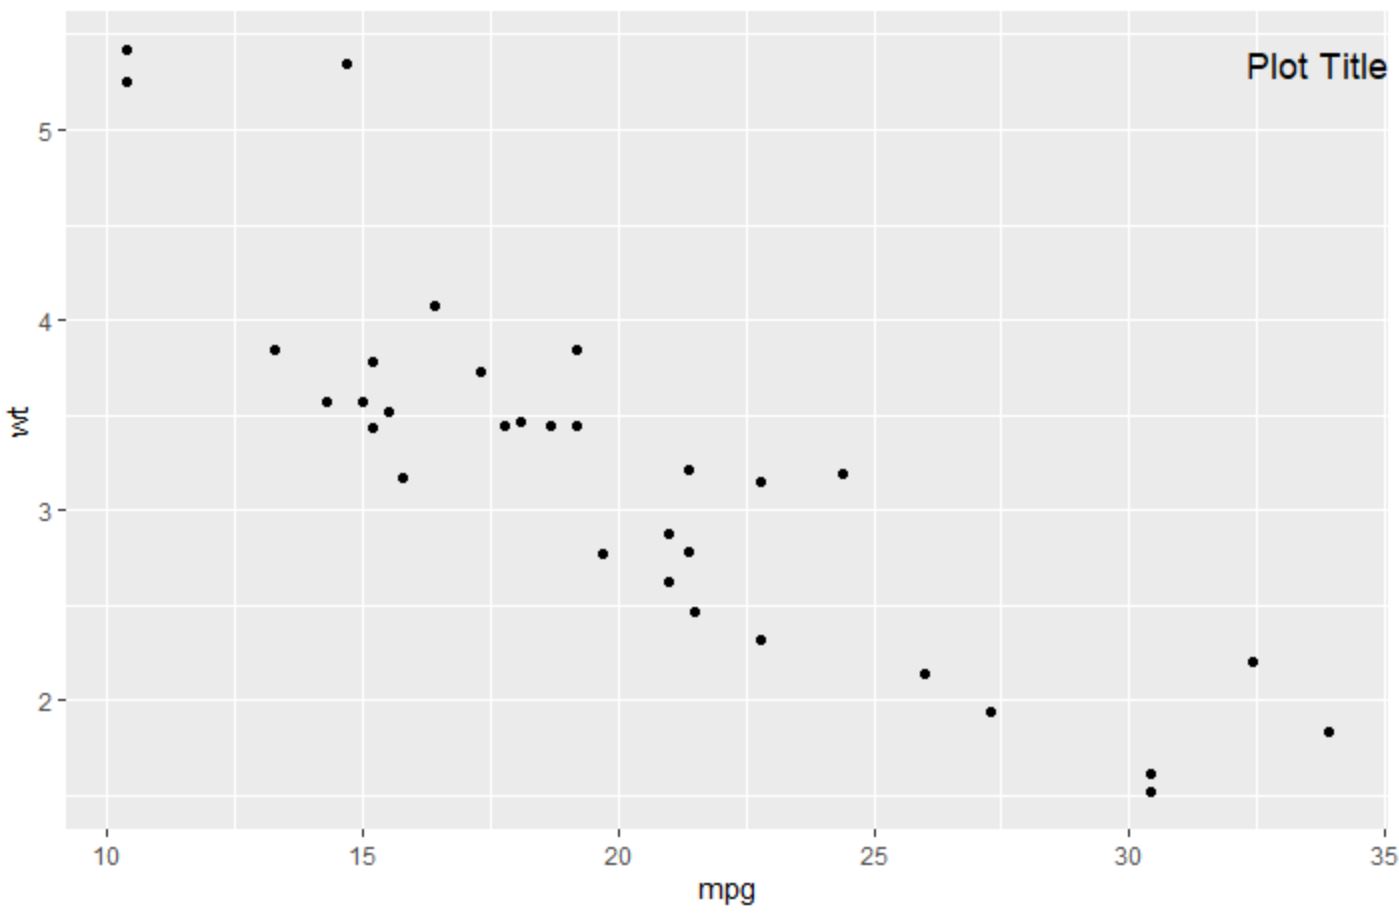
ခေါင်းစဉ်ကို ယခုဇာတ်ကွက်အတွင်း ရွှေ့ထားကြောင်း သတိပြုပါ။
ထပ်လောင်းအရင်းအမြစ်များ
အောက်ဖော်ပြပါ သင်ခန်းစာများသည် ggplot2 တွင် အခြားသော ဘုံလုပ်ဆောင်ချက်များကို မည်သို့လုပ်ဆောင်ရမည်ကို ရှင်းပြသည်-
ggplot2 တွင်ဒဏ္ဍာရီခေါင်းစဉ်ကိုဘယ်လိုပြောင်းမလဲ။
ggplot2 တွင် ဝင်ရိုးတံဆိပ်များကို လှည့်နည်း
R တွင် ပြင်ဆင်နည်း- function “ ggplot” ကို ရှာမတွေ့ပါ။
စာရေးသူအကြောင်း
Benjamin Anderson
မင်္ဂလာပါ၊ ကျွန်ုပ်သည် အငြိမ်းစား စာရင်းအင်း ပါမောက္ခ ဘင်ဂျမင်ဖြစ်ပြီး သီးသန့် Statorials ဆရာအဖြစ် လှည့်ပတ်ပါသည်။ စာရင်းဇယားနယ်ပယ်တွင် ကျယ်ပြန့်သောအတွေ့အကြုံနှင့် ကျွမ်းကျင်မှုနှင့်အတူ၊ Statorials မှတစ်ဆင့် ကျောင်းသားများကို ခွန်အားဖြစ်စေရန်အတွက် ကျွန်ုပ်၏အသိပညာကို မျှဝေလိုပါသည်။ ပိုသိတယ်။