Ggplot2 တွင် ဒဏ္ဍာရီအရာများကြားအကွာအဝေးကို မည်သို့ပြောင်းလဲမည်နည်း။
ggplot2 တွင် ဒဏ္ဍာရီဒြပ်စင်များကြား အကွာအဝေးကို ပြောင်းလဲရန် အောက်ပါနည်းလမ်းများကို သင်သုံးနိုင်သည်။
နည်းလမ်း 1- အလျားလိုက်အကွာအဝေးကိုပြောင်းပါ။
 p+
  theme(legend. spacing . x = unit(1, ' cm '))
နည်းလမ်း 2- ဒေါင်လိုက်အကွာအဝေးကို ပြောင်းပါ။
 p+
  theme(legend. spacing . y = unit(1, ' cm ')) +
  guides(fill = guide_legend(byrow = TRUE ))
အောက်ပါဥပမာများသည် အောက်ပါဒေတာဘောင်ဖြင့် နည်းလမ်းတစ်ခုစီကို လက်တွေ့အသုံးပြုနည်းကို ပြသသည်-
 #create data frame
df <- data. frame (team=c('Mavs', 'Heat', 'Nets', 'Lakers', 'Suns', 'Cavs'),
                 points=c(24, 20, 34, 39, 28, 29),
                 assists=c(5, 7, 6, 9, 12, 13))

#view data frame
df

    team points assists
1 Mavs 24 5
2 Heat 20 7
3 Nets 34 6
4 Lakers 39 9
5 Suns 28 12
6 Cavs 29 13
ဥပမာ 1- ဒဏ္ဍာရီဒြပ်စင်များကြား အလျားလိုက်အကွာအဝေးကို ပြောင်းပါ။
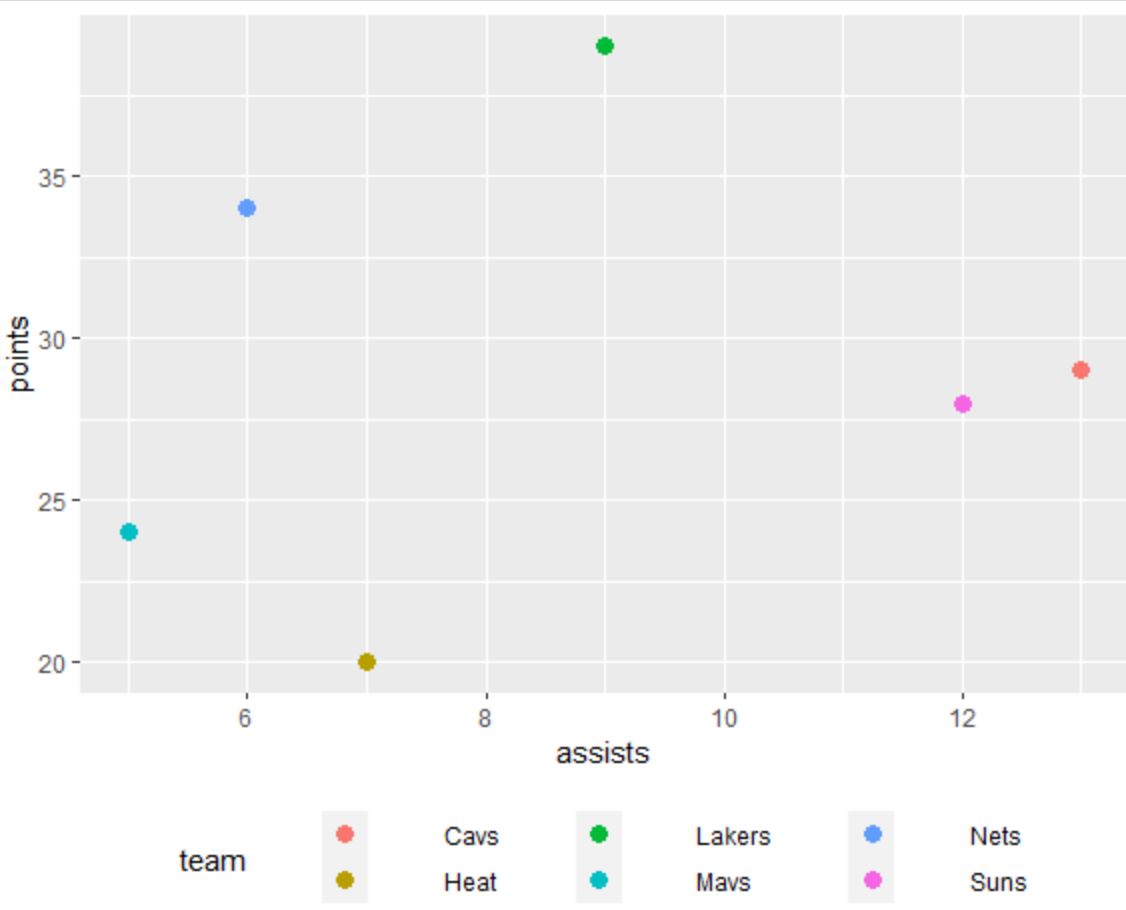
အောက်ပါကုဒ်သည် ပုံသေအကွာအဝေးဖြင့် အလျားလိုက် ဒဏ္ဍာရီတစ်ခုဖြင့် ggplot2 တွင် scatterplot တစ်ခုကို ဖန်တီးနည်းကို ပြသသည်-
 library (ggplot2)

#create scatterplot with default spacing in legend
ggplot(df, aes(x=assists, y=points, color=team)) +
  geom_point(size= 3 ) +
  theme(legend. position = ' bottom ')
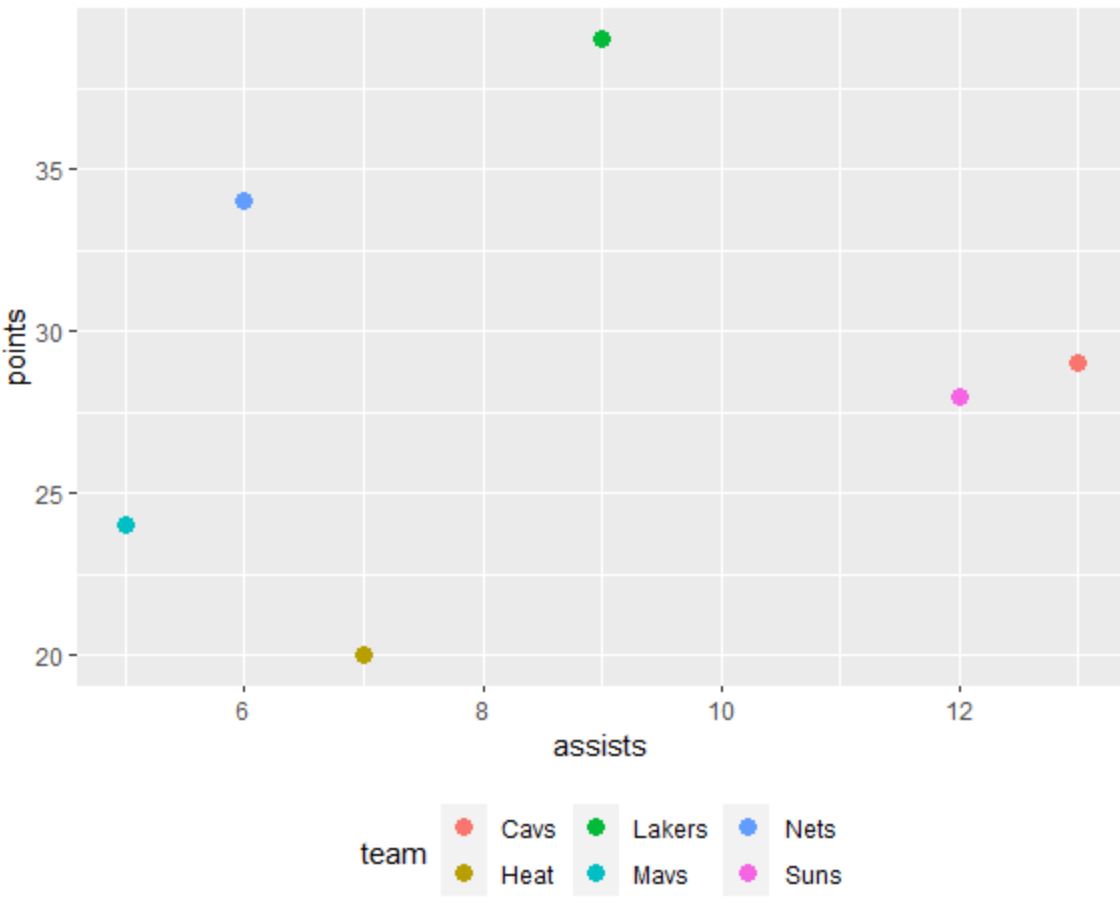
ဒဏ္ဍာရီဒြပ်စင်များကြား အလျားလိုက်အကွာအဝေးကို တိုးမြှင့်ရန် Legend.spacing.x အကြောင်းပြချက်ကို အသုံးပြုနိုင်သည်။
 library (ggplot2)

#create scatterplot with increased horizontal spacing in legend
ggplot(df, aes(x=assists, y=points, color=team)) +
  geom_point(size= 3 ) +
  theme(legend. position = ' bottom ',
        legend. spacing . x = unit(1, ' cm '))
ဒဏ္ဍာရီဒြပ်စင်များကြား အလျားလိုက်အကွာအဝေး တိုးလာကြောင်း သတိပြုပါ။
ယူနစ်() လုပ်ဆောင်ချက်တွင် သင်အသုံးပြုသည့် တန်ဖိုးကြီးလေ၊ ဒြပ်စင်များကြား အကွာအဝေး ပိုများလေဖြစ်သည်။
ဥပမာ 2- စာတန်းအစိတ်အပိုင်းများကြား ဒေါင်လိုက်အကွာအဝေးကို ပြောင်းပါ။
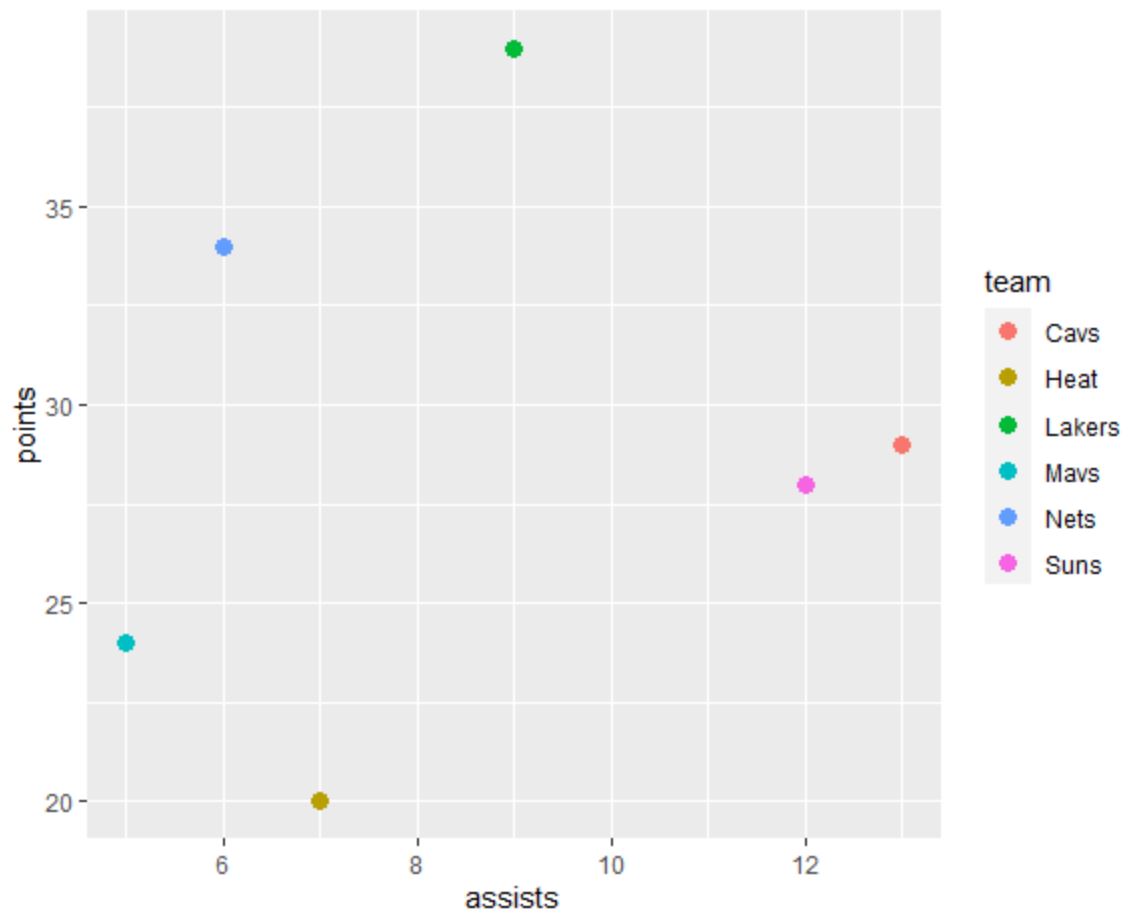
အောက်ပါကုဒ်သည် ပုံသေအကွာအဝေးဖြင့် ဒေါင်လိုက်ဒဏ္ဍာရီဖြင့် ggplot2 တွင် scatterplot တစ်ခုကို ဖန်တီးနည်းကို ပြသသည်-
 library (ggplot2)

#create scatterplot with default spacing in legend
ggplot(df, aes(x=assists, y=points, color=team)) +
  geom_point(size= 3 )
ဒဏ္ဍာရီဒြပ်စင်များကြား ဒေါင်လိုက်အကွာအဝေးကို တိုးမြှင့်ရန် Legend.spacing.y အငြင်းအခုံကို အသုံးပြုနိုင်သည်။
 library (ggplot2)

#create scatterplot with increased vertical spacing in legend
ggplot(df, aes(x=assists, y=points, color=team)) +
  geom_point(size= 3 ) +
  theme(legend. spacing . y = unit(1, ' cm ')) +
  guides(fill = guide_legend(byrow = TRUE ))
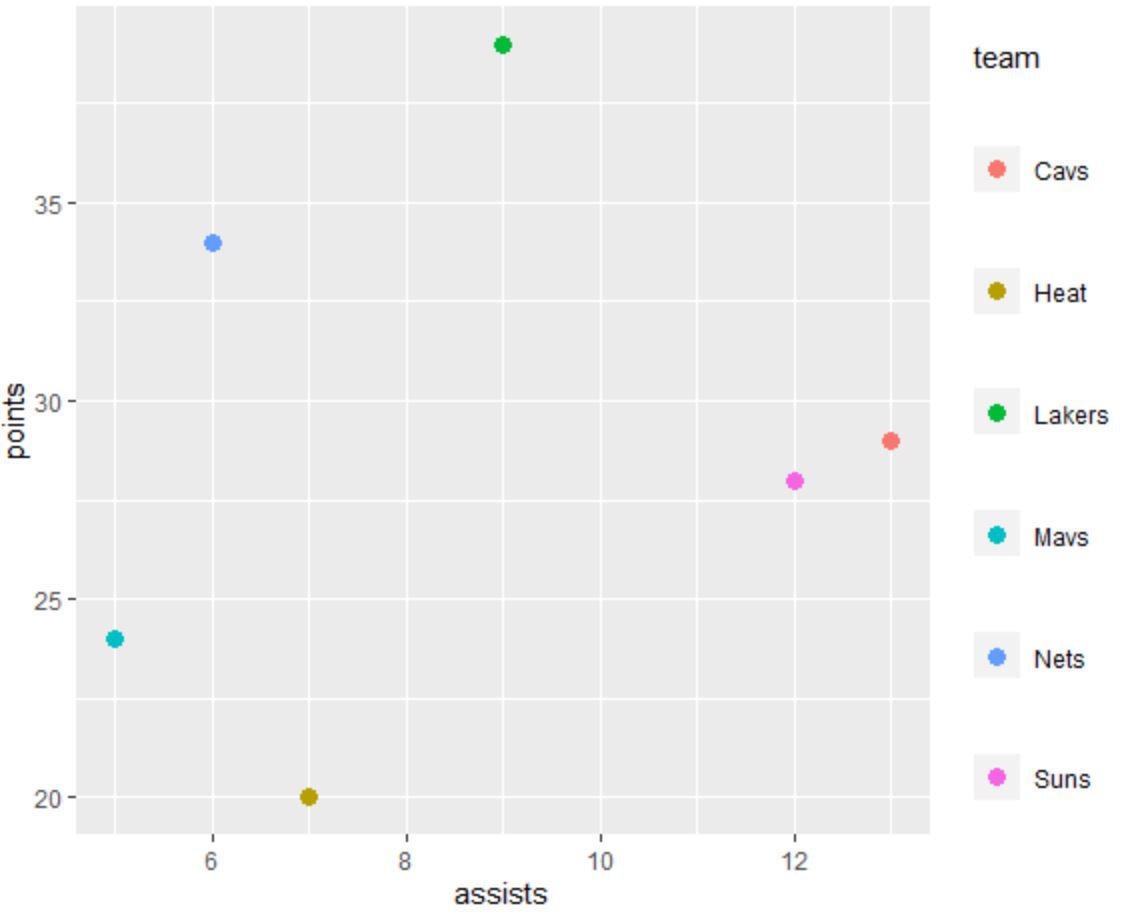
ဒဏ္ဍာရီဒြပ်စင်များကြား ဒေါင်လိုက်အကွာအဝေး တိုးလာသည်ကို သတိပြုပါ။
ယူနစ်() လုပ်ဆောင်ချက်တွင် သင်အသုံးပြုသည့် တန်ဖိုးကြီးလေ၊ ဒြပ်စင်များကြား အကွာအဝေး ပိုများလေဖြစ်သည်။
မှတ်ချက် – byrow = TRUE အငြင်းအခုံကို အသုံးပြုသည့် နောက်ဆုံးစာကြောင်းကို သင်ထည့်သွင်းရမည်၊ မဟုတ်ပါက ဒဏ္ဍာရီဒြပ်စင်များသည် မျှော်လင့်ထားသည့်အတိုင်း ကွာဟမည်မဟုတ်ပါ။
ထပ်လောင်းအရင်းအမြစ်များ
အောက်ဖော်ပြပါ သင်ခန်းစာများသည် ggplot2 တွင် အခြားသော ဘုံလုပ်ဆောင်ချက်များကို မည်သို့လုပ်ဆောင်ရမည်ကို ရှင်းပြသည်-
ggplot2 တွင်ဒဏ္ဍာရီခေါင်းစဉ်ကိုဘယ်လိုပြောင်းမလဲ။
ggplot2 တွင် ဒဏ္ဍာရီအရွယ်အစားကို မည်သို့ပြောင်းလဲမည်နည်း။
ggplot2 တွင် ဒဏ္ဍာရီ အနေအထားကို ဘယ်လိုပြောင်းမလဲ။
စာရေးသူအကြောင်း
Benjamin Anderson
မင်္ဂလာပါ၊ ကျွန်ုပ်သည် အငြိမ်းစား စာရင်းအင်း ပါမောက္ခ ဘင်ဂျမင်ဖြစ်ပြီး သီးသန့် Statorials ဆရာအဖြစ် လှည့်ပတ်ပါသည်။ စာရင်းဇယားနယ်ပယ်တွင် ကျယ်ပြန့်သောအတွေ့အကြုံနှင့် ကျွမ်းကျင်မှုနှင့်အတူ၊ Statorials မှတစ်ဆင့် ကျောင်းသားများကို ခွန်အားဖြစ်စေရန်အတွက် ကျွန်ုပ်၏အသိပညာကို မျှဝေလိုပါသည်။ ပိုသိတယ်။