Ggplot2 တွင် နောက်ခံအရောင်ပြောင်းနည်း (ဥပမာများနှင့်အတူ)
ggplot2 ကွက်ကွက်တစ်ခုတွင် အမျိုးမျိုးသောဒြပ်စင်များ၏ နောက်ခံအရောင်ကို ပြောင်းလဲရန် အောက်ပါအထားအသိုကို အသုံးပြုနိုင်သည်။
 p + theme(panel. background = element_rect(fill = ' lightblue ', color = ' purple '),
          panel. grid . major = element_line(color = ' red ', linetype = ' dotted '),
          panel. grid . minor = element_line(color = ' green ', size = 2 ))
နောက်ခံအရောင်ကို အလိုအလျောက်ပြောင်းရန် built-in ggplot2 အပြင်အဆင်များကိုလည်း အသုံးပြုနိုင်သည်။ ဤသည်မှာ အသုံးအများဆုံးအကြောင်းအရာများထဲမှ အချို့ဖြစ်သည်။
 p + theme_bw() #white background and gray gridlines
p + theme_minimal() #no background annotations
p + theme_classic() #axis lines but no gridlines
အောက်ပါဥပမာများသည် ဤ syntax ကိုလက်တွေ့တွင်မည်သို့အသုံးပြုရမည်ကိုပြသထားသည်။
ဥပမာ 1- စိတ်ကြိုက်နောက်ခံအရောင်ကို သတ်မှတ်ပါ။
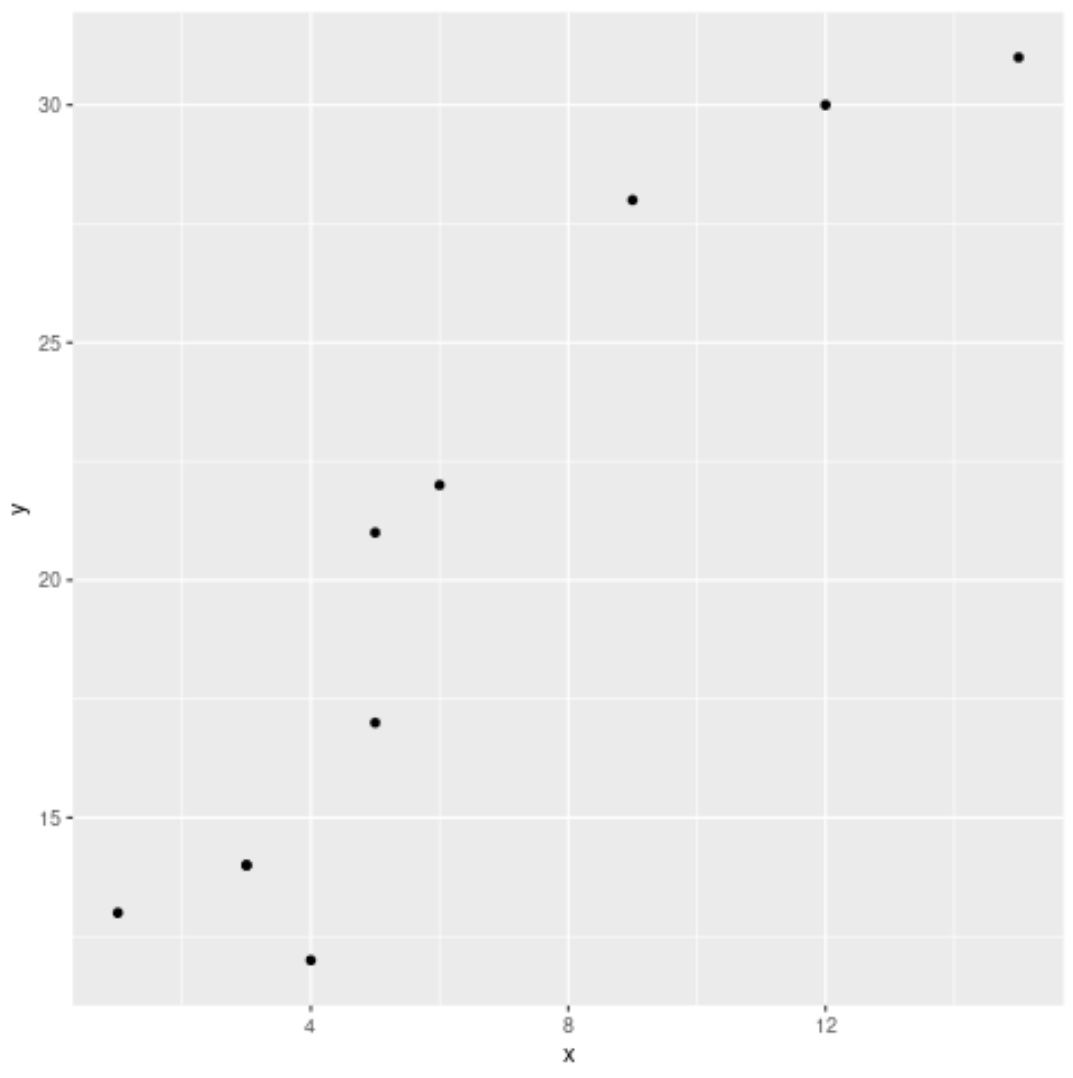
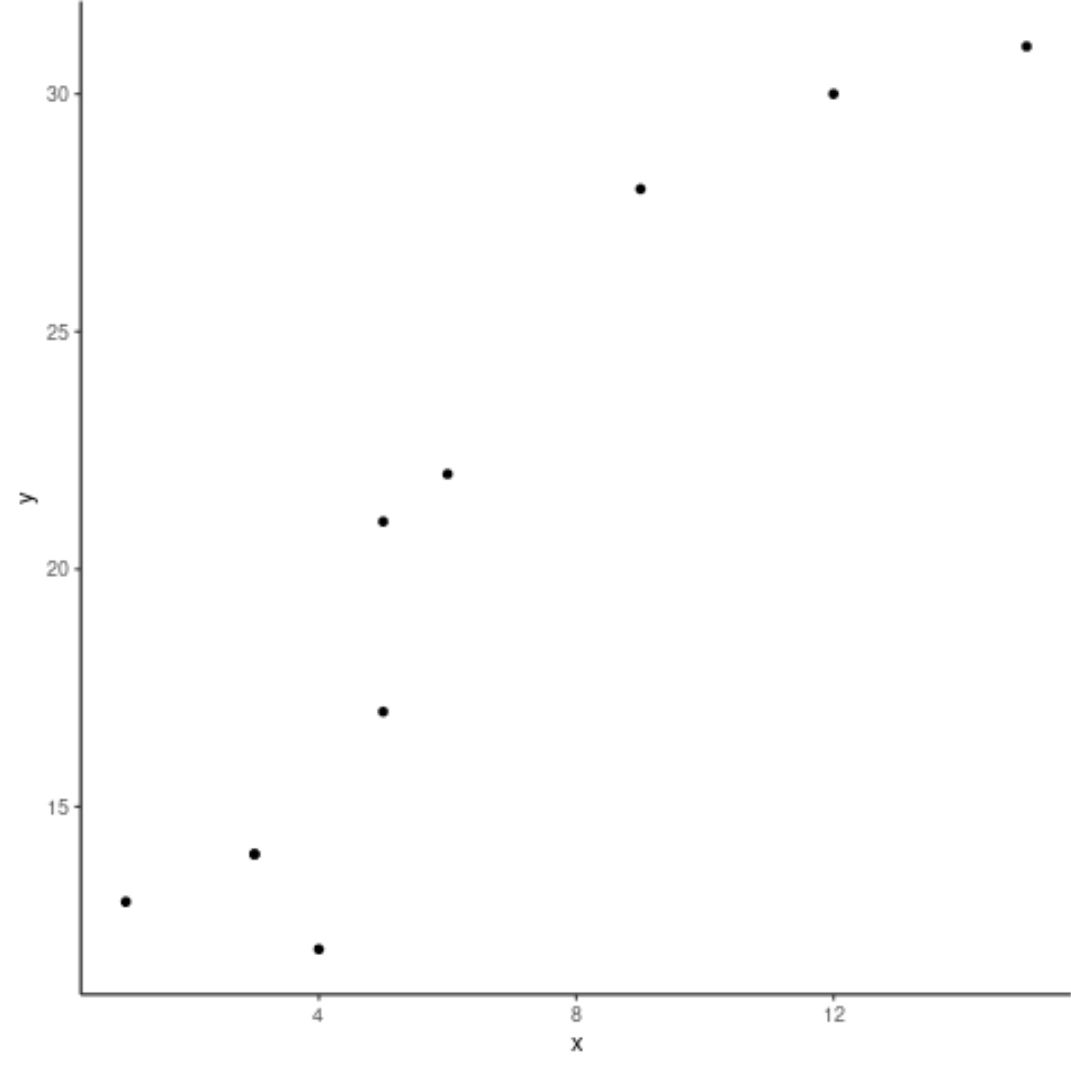
အောက်ပါကုဒ်သည် ပုံသေမီးခိုးရောင်နောက်ခံဖြင့် ggplot2 တွင် အခြေခံ scatterplot ဖန်တီးနည်းကို ပြသသည်-
 library (ggplot2)

#create data frame
df <- data. frame (x=c(1, 3, 3, 4, 5, 5, 6, 9, 12, 15),
                 y=c(13, 14, 14, 12, 17, 21, 22, 28, 30, 31))

#create scatterplot
p <- ggplot(df, aes (x=x, y=y)) +
       geom_point()

#display scatterplot
p
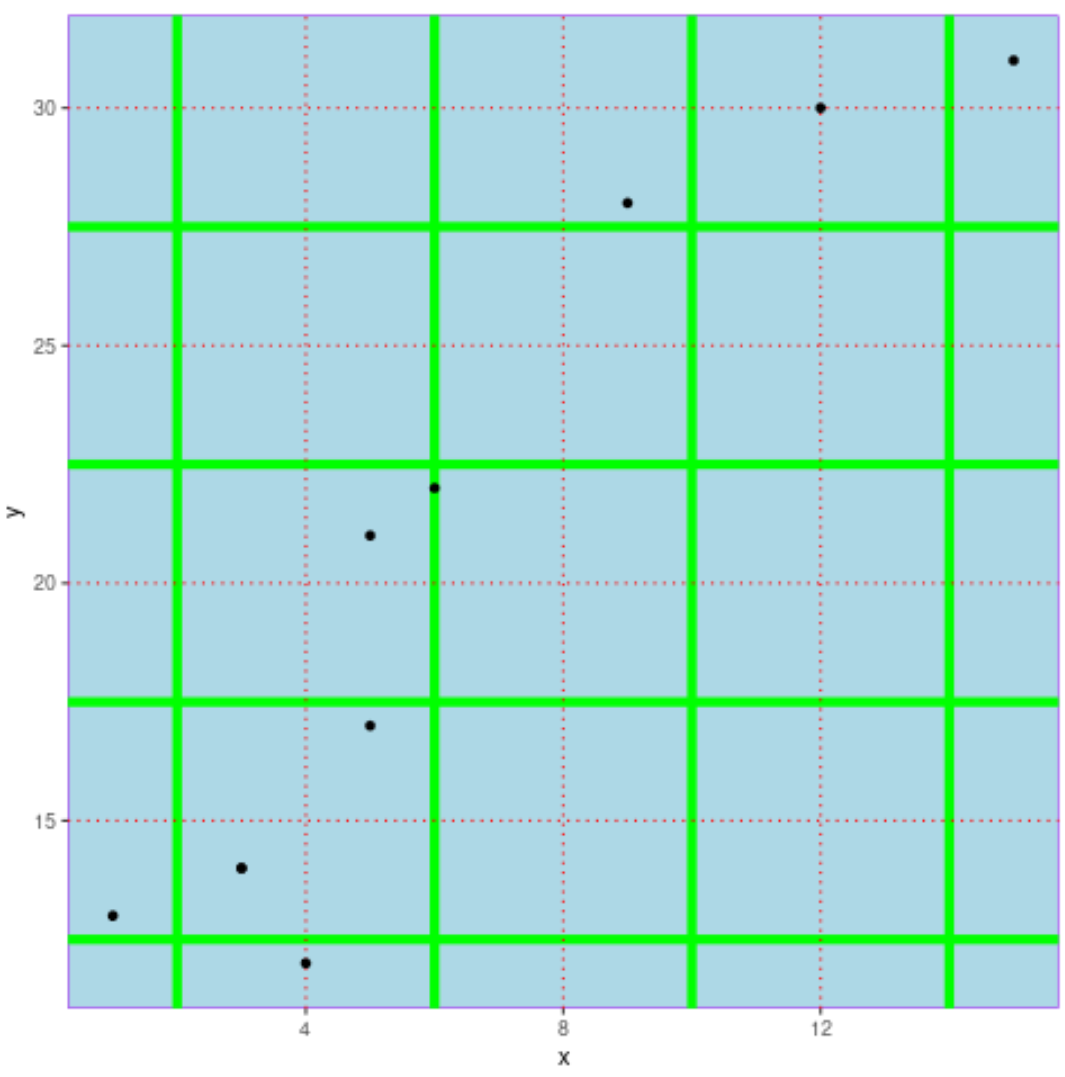
အကန့်၏နောက်ခံအရောင်အပြင် အဓိကနှင့်အသေးစားဇယားကွက်များကို ပြောင်းလဲရန် အောက်ပါကုဒ်ကို ကျွန်ုပ်တို့အသုံးပြုနိုင်သည်-
 p + theme(panel. background = element_rect(fill = ' lightblue ', color = ' purple '),
          panel. grid . major = element_line(color = ' red ', linetype = ' dotted '),
          panel. grid . minor = element_line(color = ' green ', size = 2 ))
ဥပမာ 2- နောက်ခံအရောင်ပြောင်းရန် built-in အပြင်အဆင်ကိုသုံးပါ။
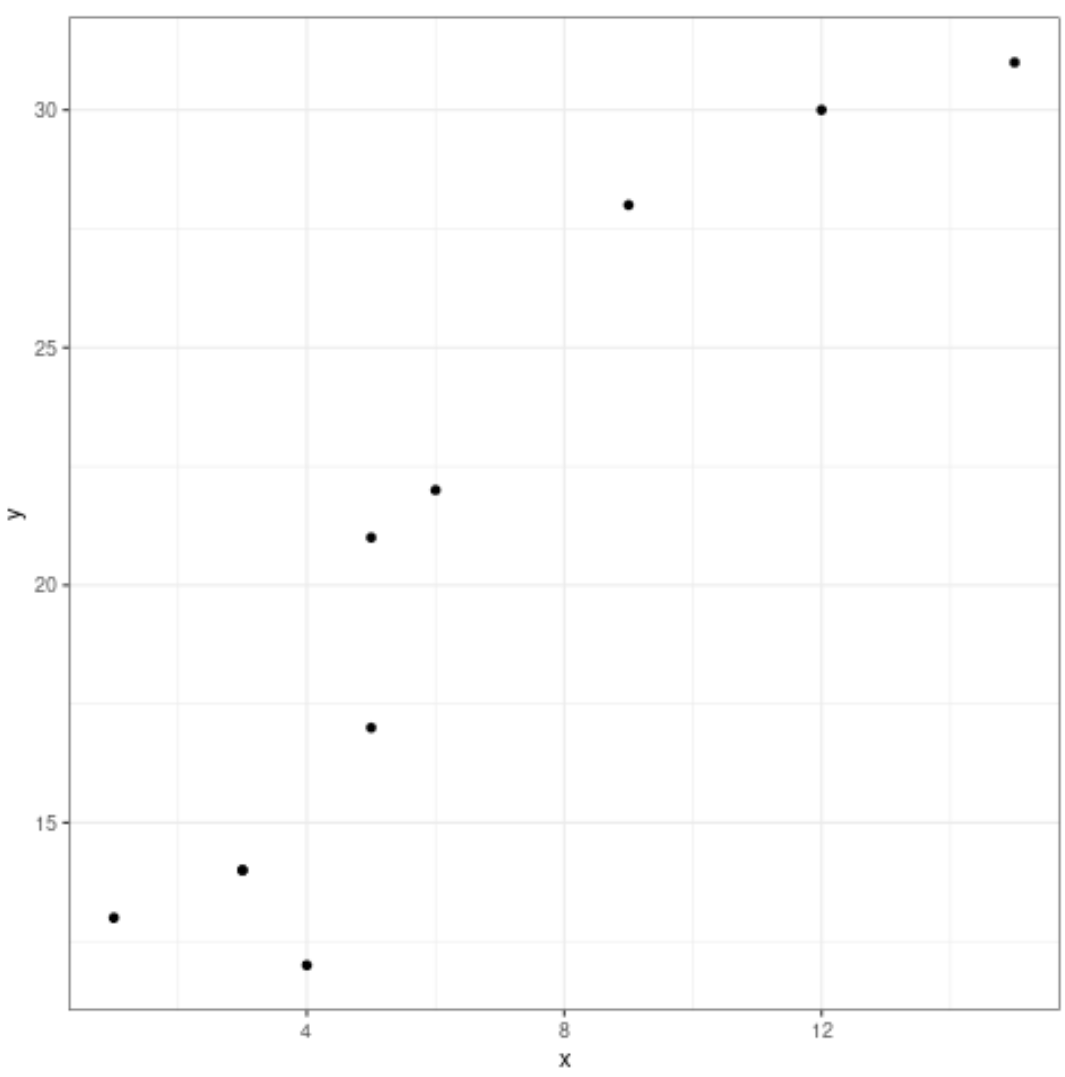
အောက်ဖော်ပြပါ ကုဒ်သည် ကွက်ကွက်များ၏ နောက်ခံအရောင်ကို အလိုအလျောက် ပြောင်းလဲရန် အမျိုးမျိုးသော တပ်ဆင်ထားသည့် ggplot2 အပြင်အဆင်များကို အသုံးပြုနည်းကို သရုပ်ပြသည်-
p + theme_bw() #white background and gray gridlines
p + theme_minimal() #no background annotations
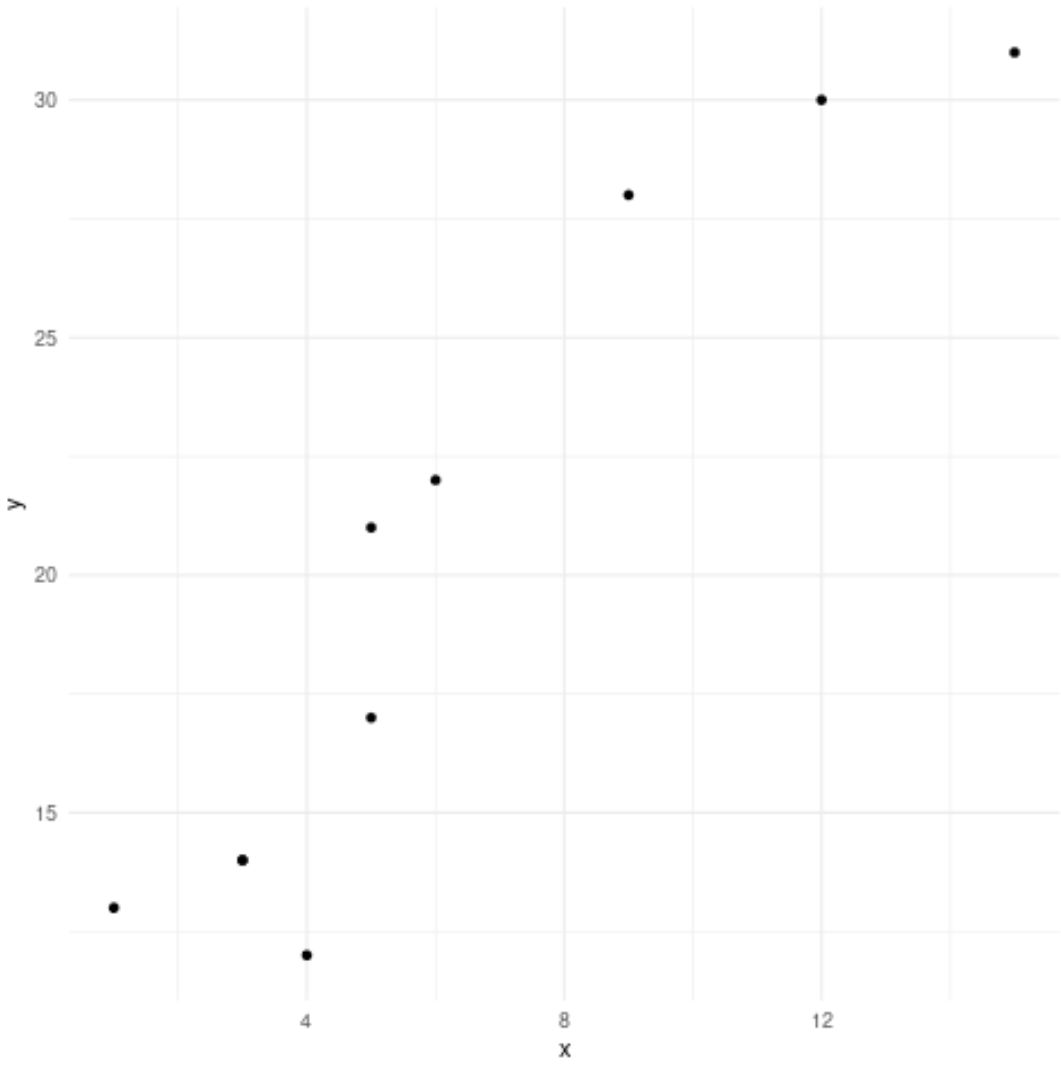
p + theme_classic() #axis lines but no gridlines
ထပ်လောင်းအရင်းအမြစ်များ
ggplot2 တွင် gridline များကိုမည်သို့ဖယ်ရှားနည်း
ggplot2 တွင် ဝင်ရိုးကန့်သတ်ချက်များကို မည်သို့သတ်မှတ်မည်နည်း။
ggplot2 တွင် ဒဏ္ဍာရီ အနေအထားကို ဘယ်လိုပြောင်းမလဲ။
စာရေးသူအကြောင်း
Benjamin Anderson
မင်္ဂလာပါ၊ ကျွန်ုပ်သည် အငြိမ်းစား စာရင်းအင်း ပါမောက္ခ ဘင်ဂျမင်ဖြစ်ပြီး သီးသန့် Statorials ဆရာအဖြစ် လှည့်ပတ်ပါသည်။ စာရင်းဇယားနယ်ပယ်တွင် ကျယ်ပြန့်သောအတွေ့အကြုံနှင့် ကျွမ်းကျင်မှုနှင့်အတူ၊ Statorials မှတစ်ဆင့် ကျောင်းသားများကို ခွန်အားဖြစ်စေရန်အတွက် ကျွန်ုပ်၏အသိပညာကို မျှဝေလိုပါသည်။ ပိုသိတယ်။