Ggplot2 တွင် မျဉ်းနှစ်ကြောင်းဆွဲနည်း (ဥပမာများဖြင့်)
ggplot2 ကို အသုံးပြု၍ ဂရပ်တစ်ခုတွင် စာကြောင်းနှစ်ကြောင်းဆွဲရန် အောက်ပါအခြေခံအထားအသိုကိုသုံးနိုင်သည်။
 ggplot(df, aes (x = x_variable)) +
  geom_line( aes (y=line1, color=' line1 ')) +
  geom_line( aes (y=line2, color=' line2 '))
အောက်ပါဥပမာများသည် ဤ syntax ကိုလက်တွေ့တွင်မည်သို့အသုံးပြုရမည်ကိုပြသထားသည်။
ဥပမာ 1- ggplot2 တွင် စာကြောင်းနှစ်ကြောင်းပါသော အခြေခံကြံစည်မှု
R တွင် အောက်ပါ data frame ရှိသည်ဆိုပါစို့။
 #create data frame
df <- data. frame (day = c(1, 2, 3, 4, 5, 6, 7, 8, 9, 10),
                 sales = c(8, 8, 7, 6, 7, 8, 9, 12, 14, 18),
                 customers = c(4, 6, 6, 4, 6, 7, 8, 9, 12, 13))

#view first six rows of data frame
head(df)

  day sales customers
1 1 8 4
2 2 8 6
3 3 7 6
4 4 6 4
5 5 7 6
6 6 8 7
အောက်ဖော်ပြပါကုဒ်သည် ဤ 10 ရက်တာကာလအတွင်း စုစုပေါင်းရောင်းချမှုနှင့်ဖောက်သည်များကိုကိုယ်စားပြုရန်အတွက် ggplot2 တွင် အခြေခံကြံစည်မှုတစ်ခုဖန်တီးနည်းကိုပြသသည်-
 library (ggplot2)

#create plot with two lines
ggplot(df, aes (x = day)) +
  geom_line( aes (y=sales, color=' sales ')) +
  geom_line( aes (y=customers, color=' customers '))
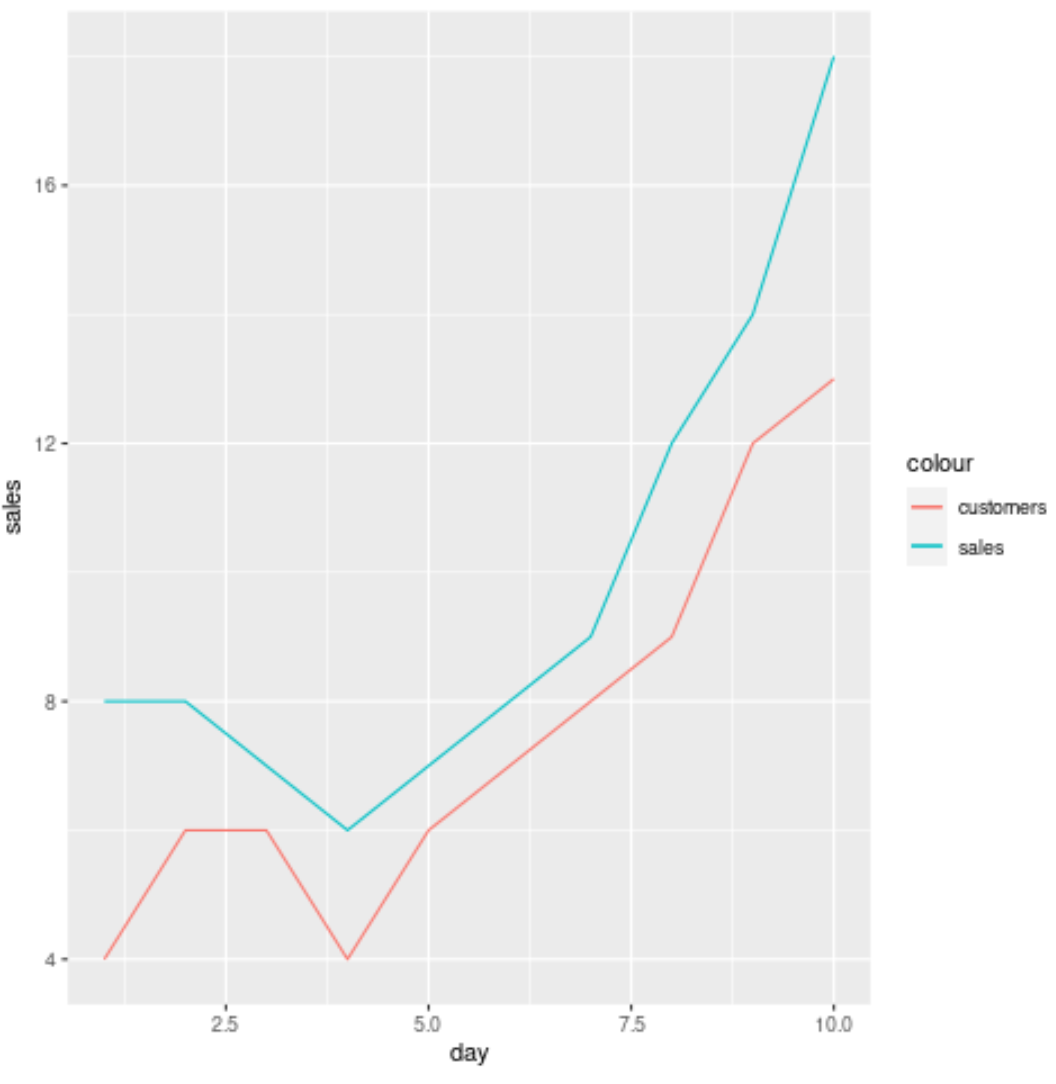
x-axis သည် နေ့ကိုပြသပြီး y-axis သည် အရောင်းနှင့်ဖောက်သည်တန်ဖိုးများကို နေ့စဉ်ပြသသည်။
ဥပမာ 2- ggplot2 တွင် စာကြောင်းနှစ်ကြောင်းပါသော စိတ်ကြိုက်ကွက်ကွက်
အောက်ပါကုဒ်သည် စိတ်ကြိုက်ခေါင်းစဉ်၊ အညွှန်းများ၊ အရောင်များ၊ လိုင်းအလေးချိန်နှင့် အပြင်အဆင်များဖြင့် ယခင်နမူနာကဲ့သို့ တူညီသောကွက်ကွက်ကို မည်သို့ဖန်တီးရမည်ကို ပြသသည်-
 library (ggplot2)

ggplot(df, aes (x = day)) +
  geom_line( aes (y=sales, color=' sales '), lwd= 2 ) +
  geom_line( aes (y = customers, color = ' customers '), lwd= 2 ) +
  scale_color_manual(' Metric ', values=c(' red ', ' steelblue ')) +
  labs(title = ' Sales & Customers by Day ', x = ' Day ', y = ' Amount ') +
  theme_minimal()
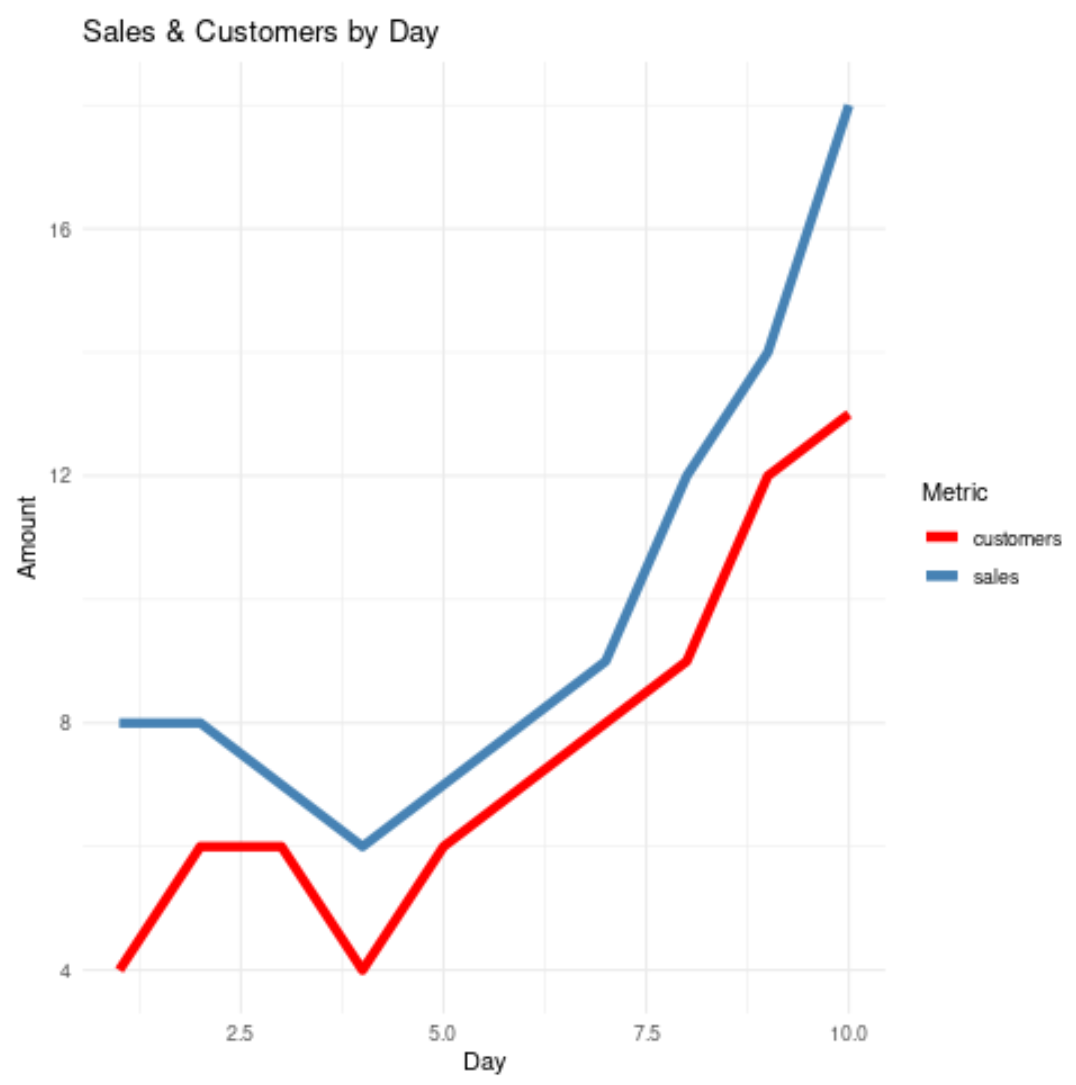
ဤဇာတ်ကွက်အတွက် theme_minimal() ကို အသုံးပြုရန် ကျွန်ုပ်တို့ရွေးချယ်ခဲ့သည်ကို သတိပြုပါ၊ သို့သော် သင့်ဇာတ်ကွက်အတွက် သင်အသုံးပြုနိုင်သည့် အပြင်အဆင်အမျိုးမျိုးရှိပါသည်။ ggplot2 အပြင်အဆင်များစာရင်းအပြည့်အစုံအတွက် ဤလမ်းညွှန် ကို ကိုးကားပါ။
ထပ်လောင်းအရင်းအမြစ်များ
အောက်ဖော်ပြပါ သင်ခန်းစာများသည် ggplot2 တွင် မျဉ်းကြောင်းများဖြင့် အခြားသော ဘုံကြံစည်မှုလုပ်ဆောင်ချက်များကို မည်သို့လုပ်ဆောင်ရမည်ကို ရှင်းပြသည်-
ggplot2 တွင်ဒဏ္ဍာရီခေါင်းစဉ်ကိုဘယ်လိုပြောင်းမလဲ။
ggplot2 ကို အသုံးပြု၍ ကွက်ကွက်တစ်ခုသို့ အလျားလိုက်မျဉ်းကို မည်သို့ထည့်မည်နည်း။
ggplot2 တွင် လိုင်းအထူကို ချိန်ညှိနည်း
စာရေးသူအကြောင်း
Benjamin Anderson
မင်္ဂလာပါ၊ ကျွန်ုပ်သည် အငြိမ်းစား စာရင်းအင်း ပါမောက္ခ ဘင်ဂျမင်ဖြစ်ပြီး သီးသန့် Statorials ဆရာအဖြစ် လှည့်ပတ်ပါသည်။ စာရင်းဇယားနယ်ပယ်တွင် ကျယ်ပြန့်သောအတွေ့အကြုံနှင့် ကျွမ်းကျင်မှုနှင့်အတူ၊ Statorials မှတစ်ဆင့် ကျောင်းသားများကို ခွန်အားဖြစ်စေရန်အတွက် ကျွန်ုပ်၏အသိပညာကို မျှဝေလိုပါသည်။ ပိုသိတယ်။