Ggplot2 ကွက်များသို့ စာသားထည့်နည်း (ဥပမာများဖြင့်)
ggplot2 ရှိ ကွက်များသို့ စာသားထည့်ရန် annotate() လုပ်ဆောင်ချက်ကို သင်အသုံးပြုနိုင်သည်။
ဤလုပ်ဆောင်ချက်သည် အောက်ပါအခြေခံ syntax ကိုအသုံးပြုသည်-
 p+
  annotate(" text ", x= 6 , y= 10 , label= " hello ")
ရွှေ-
- x၊ y : စာသားကို နေရာချရမည့် သြဒိနိတ်များ (x၊ y)။
- တံဆိပ် – ပြသရန် စာသား။
အောက်ဖော်ပြပါ ဥပမာများသည် ဤလုပ်ဆောင်ချက်ကို လက်တွေ့အသုံးချနည်းကို ပြသထားသည်။
ဥပမာ 1- ggplot2 တွင် စာသားဒြပ်စင်တစ်ခုကို ထည့်ပါ။
အောက်ပါကုဒ်သည် ggplot2 scatterplot သို့ စာသားဒြပ်စင်တစ်ခုထည့်ရန် annotate() ကိုအသုံးပြုပုံကို ပြသသည်-
 library (ggplot2)

#create data frame
df <- data. frame (x=c(1, 3, 3, 5, 7, 8, 10, 11),
                 y=c(3, 5, 7, 5, 8, 10, 14, 19))

#create scatter plot with one text element
ggplot(df, aes(x=x, y=y)) +
  geom_point()
  annotate(" text ", x= 6 , y= 10 , label= " hello ")
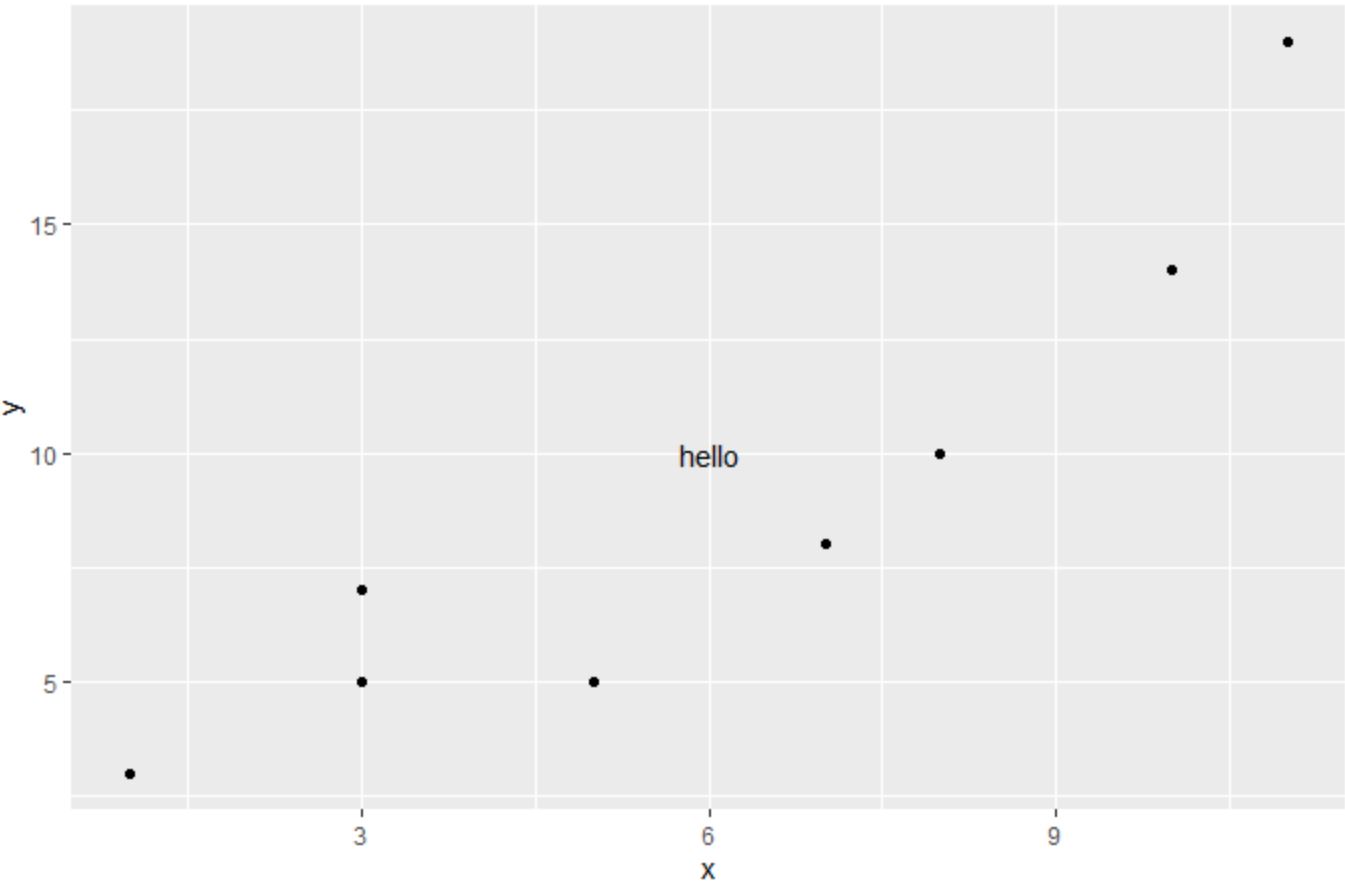
ကျွန်ုပ်တို့၏ စာသားဒြပ်စင်ကို ကွက်ကွက်အတွင်း (x၊ y) သြဒိနိတ်များတွင် ထည့်သွင်းထားကြောင်း သတိပြုပါ။
ဥပမာ 2- ggplot2 တွင် စာသားအစိတ်အပိုင်းများစွာကို ထည့်ပါ။
ggplot2 scatterplot တွင် စာသားဒြပ်စင်များစွာကို ထည့်ရန် annotate() ကို အသုံးပြုနည်းကို အောက်ပါကုဒ်က ပြသည်-
 library (ggplot2)

#create data frame
df <- data. frame (x=c(1, 3, 3, 5, 7, 8, 10, 11),
                 y=c(3, 5, 7, 5, 8, 10, 14, 19))

#create scatter plot with one text element
ggplot(df, aes(x=x, y=y)) +
  geom_point() +
  annotate(" text ", x= 6 , y= 10 , label= " hello ") +
  annotate(" text ", x= 3 , y= 15 , label= " hello again ")
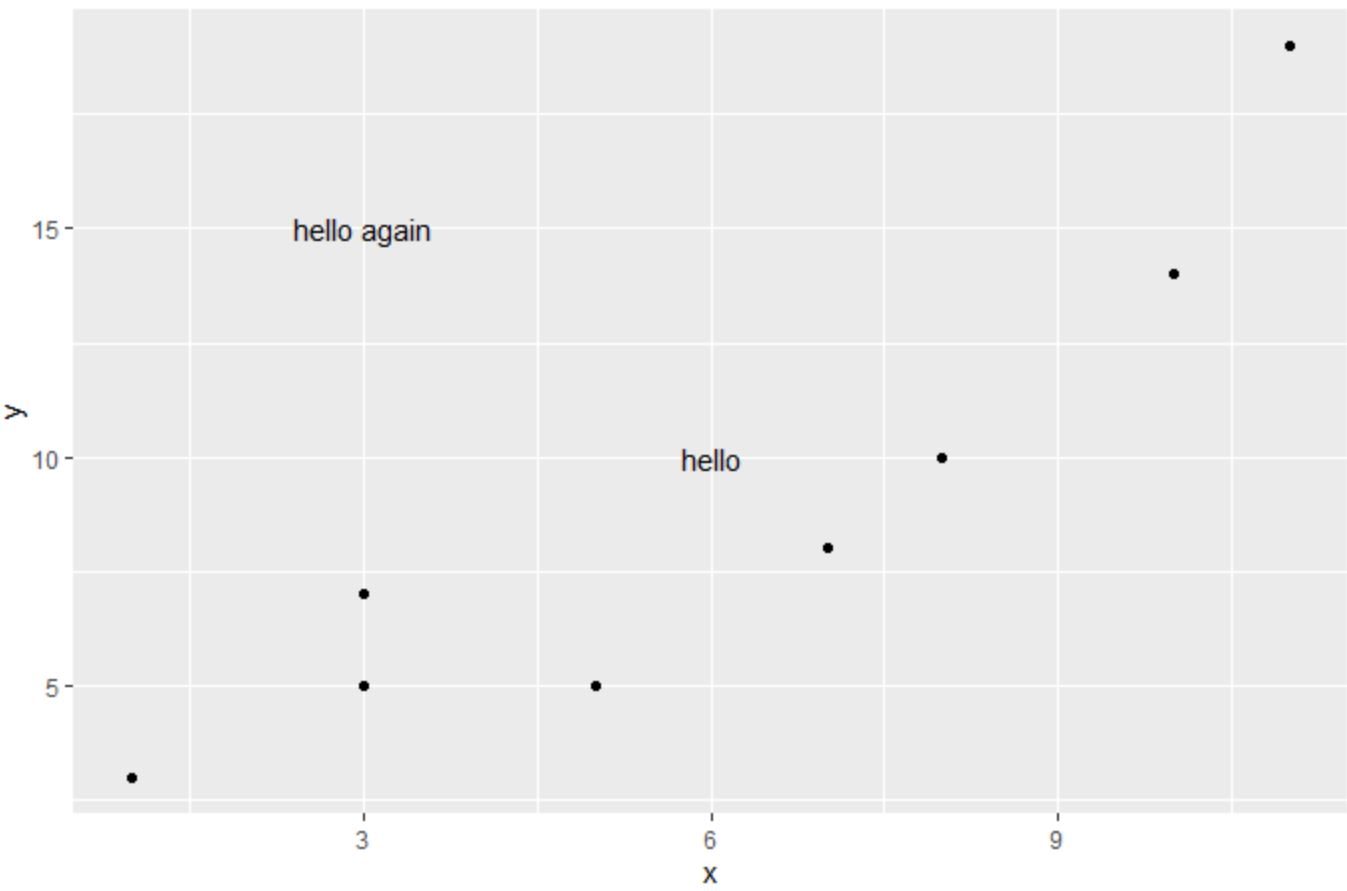
ကျွန်ုပ်တို့သတ်မှတ်ထားသော သြဒီနိတ်များတွင် စာသားဒြပ်စင်နှစ်ခုကို ကွက်ကွက်တွင် ထည့်သွင်းထားကြောင်း သတိပြုပါ။
ဥပမာ 3- ကွက်လပ်ရှိ စာသားအစိတ်အပိုင်းများကို စိတ်ကြိုက်ပြင်ဆင်ပါ။
ကွက်လပ်ရှိ စာသားဒြပ်စင်များ၏ အရွယ်အစား၊ အရောင်နှင့် ဖောင့်ပုံစံတို့ကို စိတ်ကြိုက်ပြင်ဆင်ရန် အရွယ်အစား ၊ col နှင့် italic သို့မဟုတ် bold arguments များကို သုံးနိုင်သည်-
 library (ggplot2)

#create data frame
df <- data. frame (x=c(1, 3, 3, 5, 7, 8, 10, 11),
                 y=c(3, 5, 7, 5, 8, 10, 14, 19))

#create scatter plot with custom text element
ggplot(df, aes(x=x, y=y)) +
  geom_point() +
  annotate(" text ", x= 6 , y= 10 , label= " bolditalic(hello) ",
           col=" blue ", size= 10 , parse= TRUE )
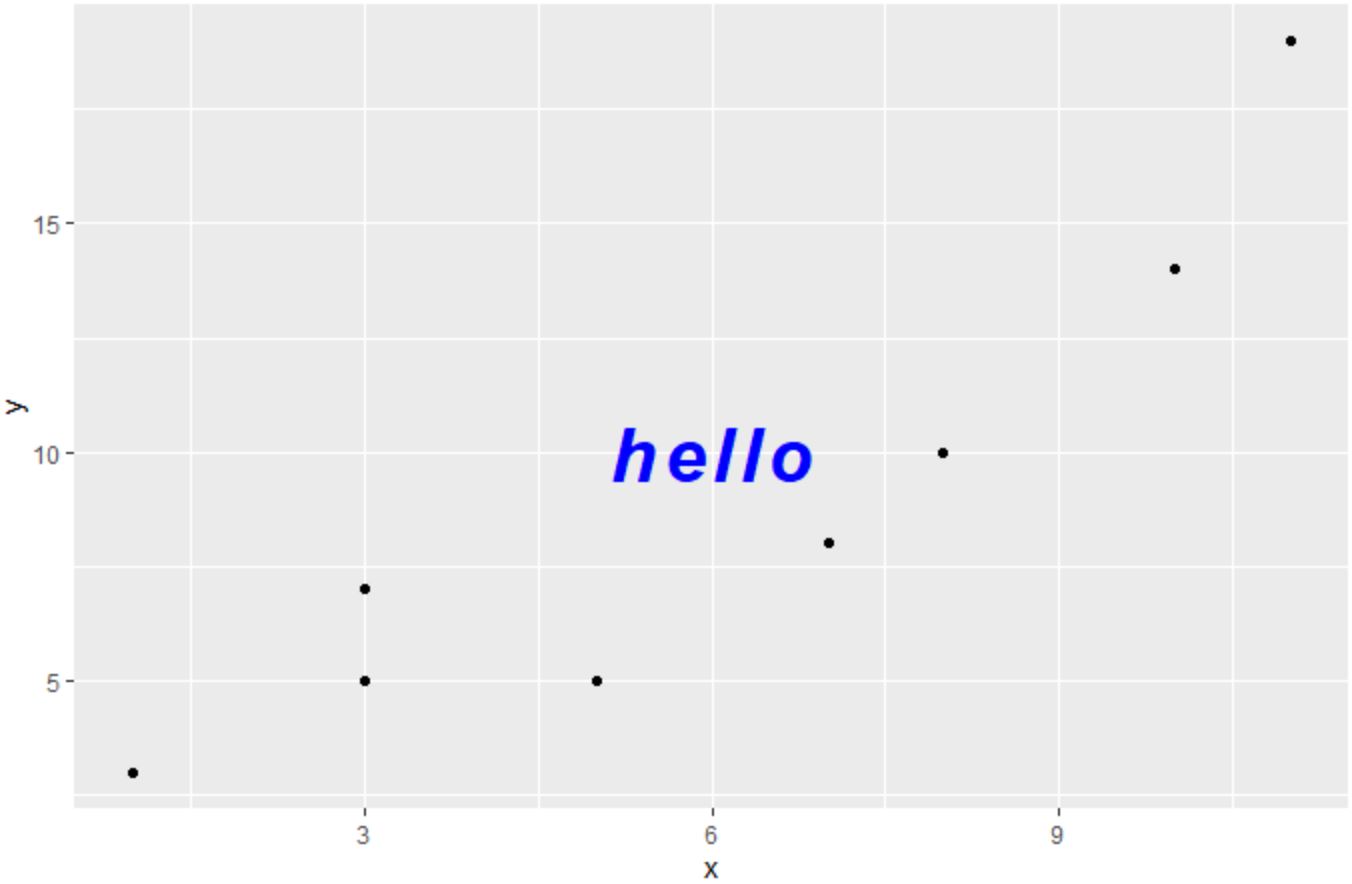
ယခုကွက်ကွက်ရှိ တစ်ခုတည်းသောစာသားဒြပ်စင်သည် ရဲရင့်ခြင်း၊ စာလုံးစောင်း၊ အပြာဖြစ်ပြီး အရွယ်အစား 10 ရှိကြောင်း သတိပြုပါ။
မှတ်ချက် – ggplot2 တွင် annotate() လုပ်ဆောင်ချက်၏ စာရွက်စာတမ်းအပြည့်အစုံကို ဤနေရာတွင် ရှာတွေ့နိုင်ပါသည်။
ထပ်လောင်းအရင်းအမြစ်များ
အောက်ဖော်ပြပါ သင်ခန်းစာများသည် R တွင် အခြားဘုံအလုပ်များကို မည်သို့လုပ်ဆောင်ရမည်ကို ရှင်းပြသည်-
ggplot2 တွင် point size ကိုဘယ်လိုပြောင်းမလဲ။
ggplot2 တွင် ခေါင်းစဉ်အနေအထားကို မည်သို့ပြောင်းရမည်နည်း။
ggplot2 တွင် ဝင်ရိုးအညွှန်းများကို ဖယ်ရှားနည်း
စာရေးသူအကြောင်း
Benjamin Anderson
မင်္ဂလာပါ၊ ကျွန်ုပ်သည် အငြိမ်းစား စာရင်းအင်း ပါမောက္ခ ဘင်ဂျမင်ဖြစ်ပြီး သီးသန့် Statorials ဆရာအဖြစ် လှည့်ပတ်ပါသည်။ စာရင်းဇယားနယ်ပယ်တွင် ကျယ်ပြန့်သောအတွေ့အကြုံနှင့် ကျွမ်းကျင်မှုနှင့်အတူ၊ Statorials မှတစ်ဆင့် ကျောင်းသားများကို ခွန်အားဖြစ်စေရန်အတွက် ကျွန်ုပ်၏အသိပညာကို မျှဝေလိုပါသည်။ ပိုသိတယ်။