Ggplot2 ကို အသုံးပြု၍ ကွက်ကွက်တစ်ခုသို့ အလျားလိုက်မျဉ်းကို မည်သို့ထည့်မည်နည်း။
အောက်ပါ syntax ကိုအသုံးပြုသည့် geom_hline() လုပ်ဆောင်ချက်ကို အသုံးပြု၍ အလျားလိုက်လိုင်းများကို ggplot2 ကွက်များသို့ အမြန်ထည့်နိုင်သည်-
geom_hline(yintercept၊ linetype၊ အရောင်၊ အရွယ်အစား)
ရွှေ-
- yintercept- y-ကြားဖြတ်ပေါ်တွင် စာကြောင်းတစ်ခုထည့်ရန် တည်နေရာ။
- linetype- လိုင်းပုံစံ။ မူရင်းမှာ “ solid” ဖြစ်သော်လည်း “ twodash” , “ longdash” , “ dotted” , “ dotdash” , “ dash” သို့မဟုတ် “ blank” ဟု သတ်မှတ်နိုင်ပါသည်။
- color: လိုင်း၏အရောင်။
- အရွယ်အစား- မျဉ်း၏ အကျယ်။
အောက်ဖော်ပြပါ ဥပမာများသည် ဤလုပ်ဆောင်ချက်ကို လက်တွေ့အသုံးချနည်းကို ပြသထားသည်။
လမ်းကြောင်းတစ်ခုသို့ အလျားလိုက်မျဉ်းတစ်ခုထည့်ပါ။
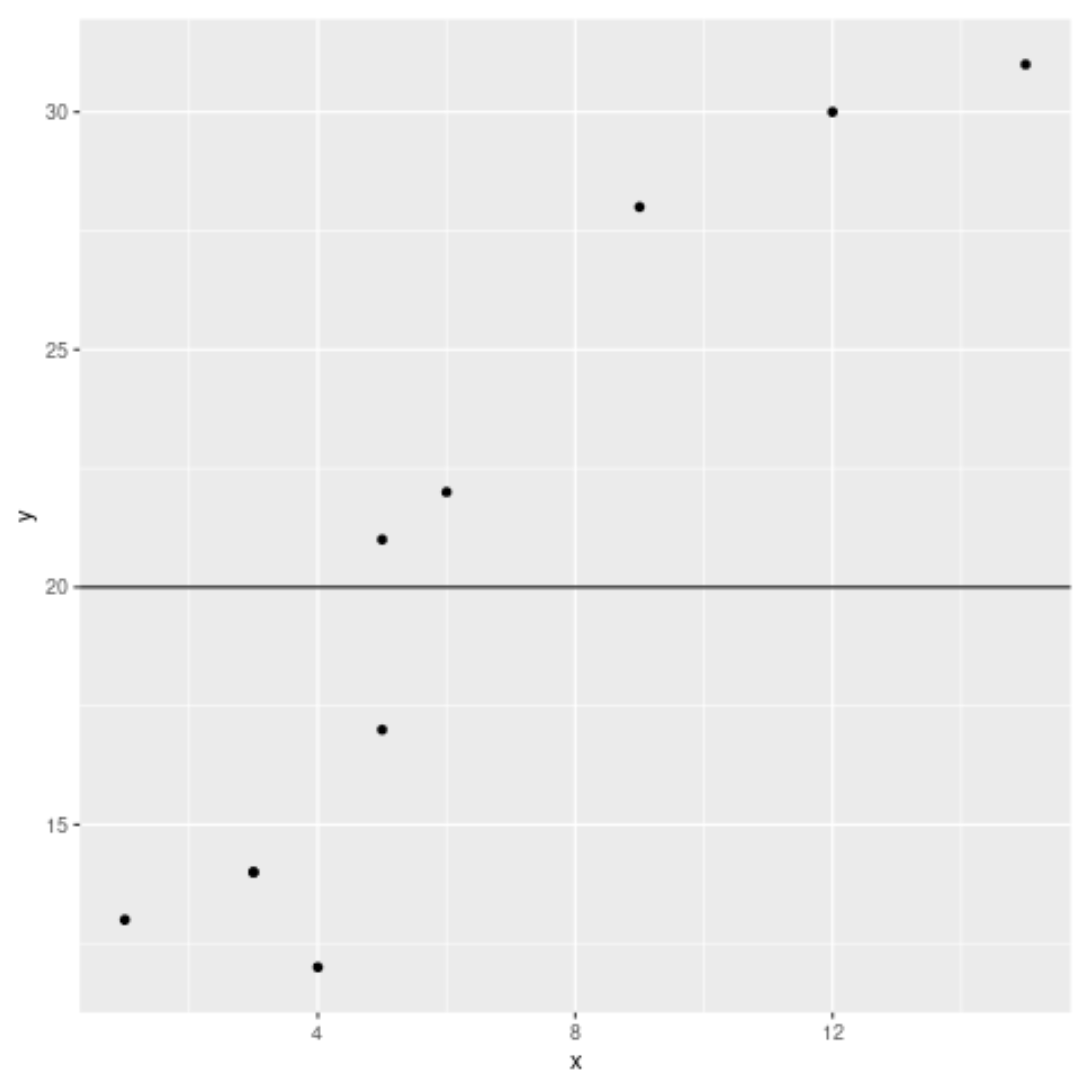
အောက်ဖော်ပြပါကုဒ်သည် ကွက်ကွက်တစ်ခုသို့ အလျားလိုက်မျဉ်းတစ်ကြောင်းကို မည်သို့ထည့်ရမည်ကို ပြသသည်-
 library (ggplot2)

#create data frame
df <- data. frame (x=c(1, 3, 3, 4, 5, 5, 6, 9, 12, 15),
                 y=c(13, 14, 14, 12, 17, 21, 22, 28, 30, 31))

#create scatterplot with horizontal line at y=20
ggplot(df, aes (x=x, y=y)) +
  geom_point() +
  geom_hline(yintercept= 20 )

လမ်းကြောင်းများဆီသို့ အလျားလိုက်မျဥ်းများစွာကို ထည့်ပါ။
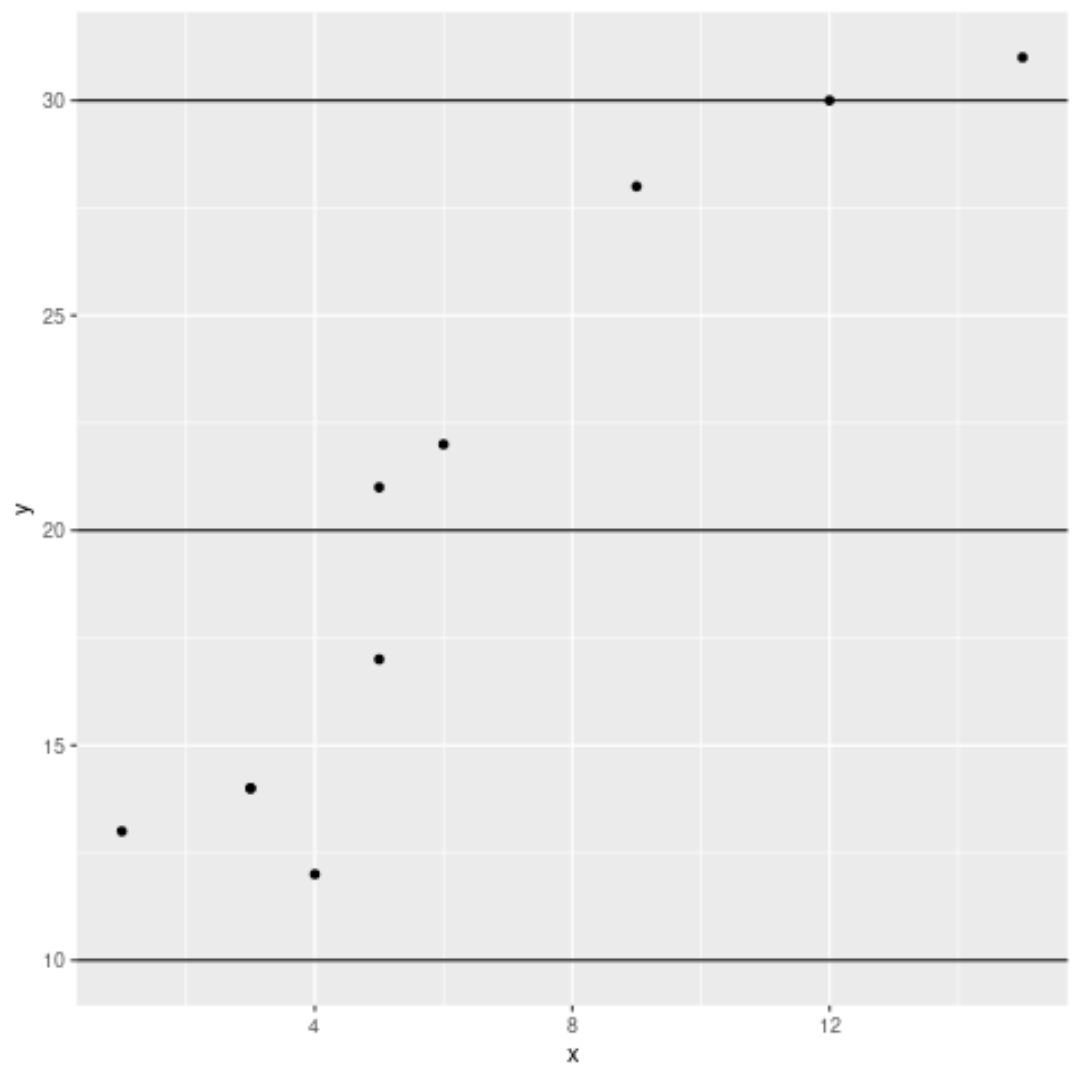
အောက်ဖော်ပြပါ ကုဒ်သည် ကွက်ကွက်တစ်ခုသို့ အလျားလိုက်မျဉ်းကြောင်းများစွာကို ထည့်သွင်းနည်းကို ပြသသည်-
 library (ggplot2)

#create data frame
df <- data. frame (x=c(1, 3, 3, 4, 5, 5, 6, 9, 12, 15),
                 y=c(13, 14, 14, 12, 17, 21, 22, 28, 30, 31))

#create scatterplot with horizontal lines at y = 10, 20, 30
ggplot(df, aes (x=x, y=y)) +
  geom_point() +
  geom_hline(yintercept=c( 10, 20, 30 ))

အလျားလိုက်လိုင်းများကို စိတ်ကြိုက်လုပ်ပါ။
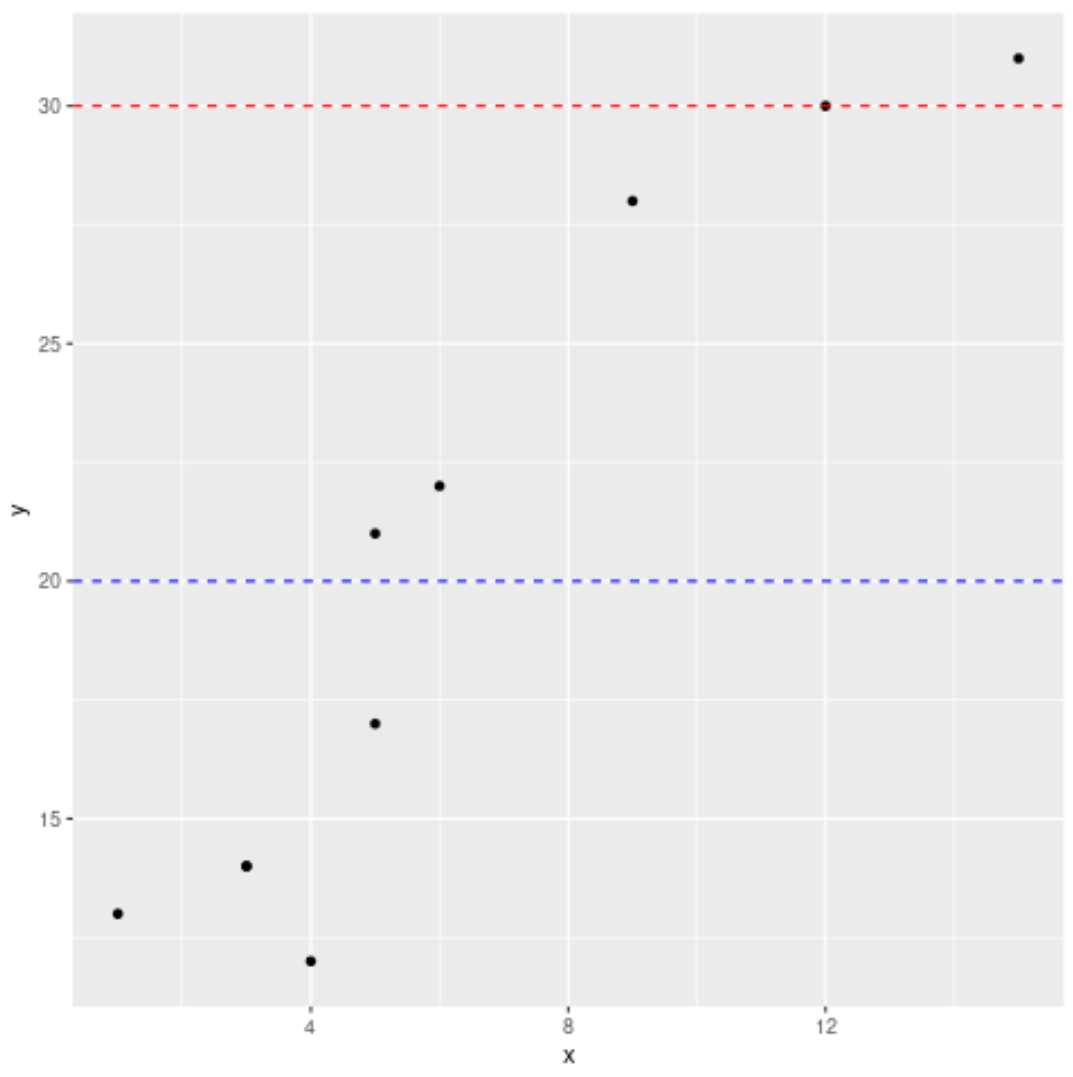
အောက်ဖော်ပြပါကုဒ်သည် ကွက်ကွက်တစ်ခုပေါ်တွင် အလျားလိုက်မျဉ်းကြောင်းများကို စိတ်ကြိုက်ပြင်ဆင်နည်းကို ပြသသည်-
 library (ggplot2)

#create data frame
df <- data. frame (x=c(1, 3, 3, 4, 5, 5, 6, 9, 12, 15),
                 y=c(13, 14, 14, 12, 17, 21, 22, 28, 30, 31))

#create scatterplot with customized horizontal lines
ggplot(df, aes (x=x, y=y)) +
  geom_point() +
  geom_hline(yintercept=c( 20 , 30 ) , linetype=' dashed ', color=c(' blue ', ' red '))

ထပ်လောင်းအရင်းအမြစ်များ
ggplot2 ကို အသုံးပြု၍ ကွက်ကွက်တစ်ခုသို့ ဒေါင်လိုက်မျဉ်းကို မည်ကဲ့သို့ ထည့်ရမည်နည်း။
ggplot2 တွင် linear regression line ကို ဘယ်လိုဆွဲမလဲ။
ggplot2 တွင် ဝင်ရိုးကန့်သတ်ချက်များကို မည်သို့သတ်မှတ်မည်နည်း။