Ggplot2 ကို အသုံးပြု၍ ကွက်ကွက်တစ်ခုသို့ ဒေါင်လိုက်မျဉ်းကို မည်ကဲ့သို့ ထည့်ရမည်နည်း။
အောက်ပါ syntax ကိုအသုံးပြုသည့် geom_vline() လုပ်ဆောင်ချက်ကို အသုံးပြု၍ ဒေါင်လိုက်လိုင်းများကို ggplot2 ကွက်များသို့ လျင်မြန်စွာ ထည့်သွင်းနိုင်သည်-
geom_vline(xintercept၊ လိုင်းအမျိုးအစား၊ အရောင်၊ အရွယ်အစား)
ရွှေ-
- xintercept- x လမ်းဆုံတွင် မျဉ်းတစ်ကြောင်းထည့်ရန် တည်နေရာ။ တစ်ခု သို့မဟုတ် တစ်ခုထက်ပိုသော တန်ဖိုးများ ဖြစ်နိုင်သည်။
- linetype- လိုင်းပုံစံ။ မူရင်းမှာ “ solid” ဖြစ်သော်လည်း “ twodash” , “ longdash” , “ dotted” , “ dotdash” , “ dash” သို့မဟုတ် “ blank” ဟု သတ်မှတ်နိုင်ပါသည်။
- color: လိုင်း၏အရောင်။
- အရွယ်အစား- မျဉ်း၏ အကျယ်။
အောက်ဖော်ပြပါ ဥပမာများသည် ဤလုပ်ဆောင်ချက်ကို လက်တွေ့အသုံးချနည်းကို ပြသထားသည်။
လမ်းကြောင်းတစ်ခုသို့ ဒေါင်လိုက်မျဉ်းတစ်ခုထည့်ပါ။
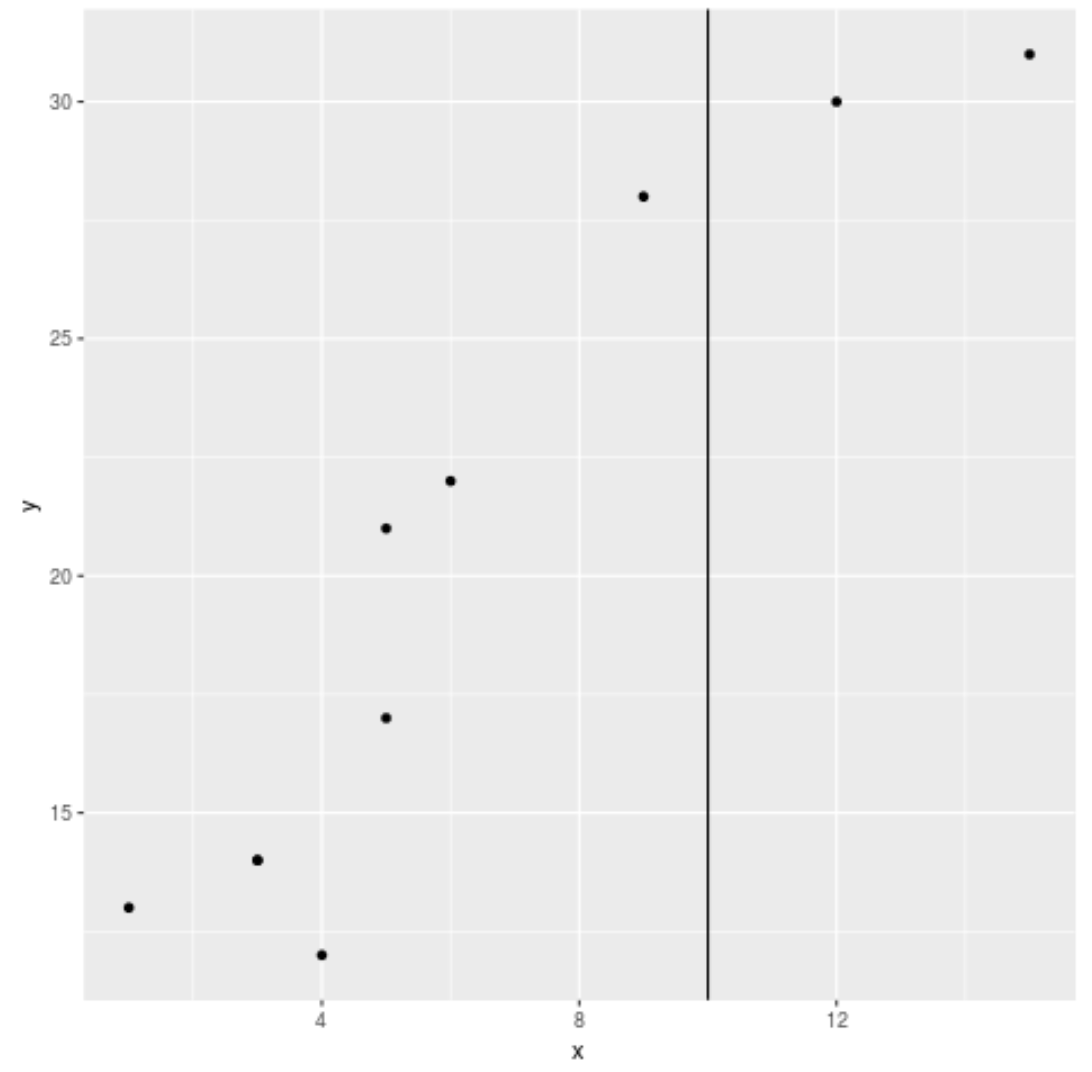
အောက်ဖော်ပြပါ ကုဒ်သည် ကွက်ကွက်တစ်ခုသို့ ဒေါင်လိုက်မျဉ်းတစ်ကြောင်း ထည့်နည်းကို ပြသသည်-
 library (ggplot2)

#create data frame
df <- data.frame(x=c(1, 3, 3, 4, 5, 5, 6, 9, 12, 15),
                 y=c(13, 14, 14, 12, 17, 21, 22, 28, 30, 31))

#create scatterplot with vertical line at x=10
ggplot(df, aes (x=x, y=y)) +
  geom_point() +
  geom_vline(xintercept= 10 )
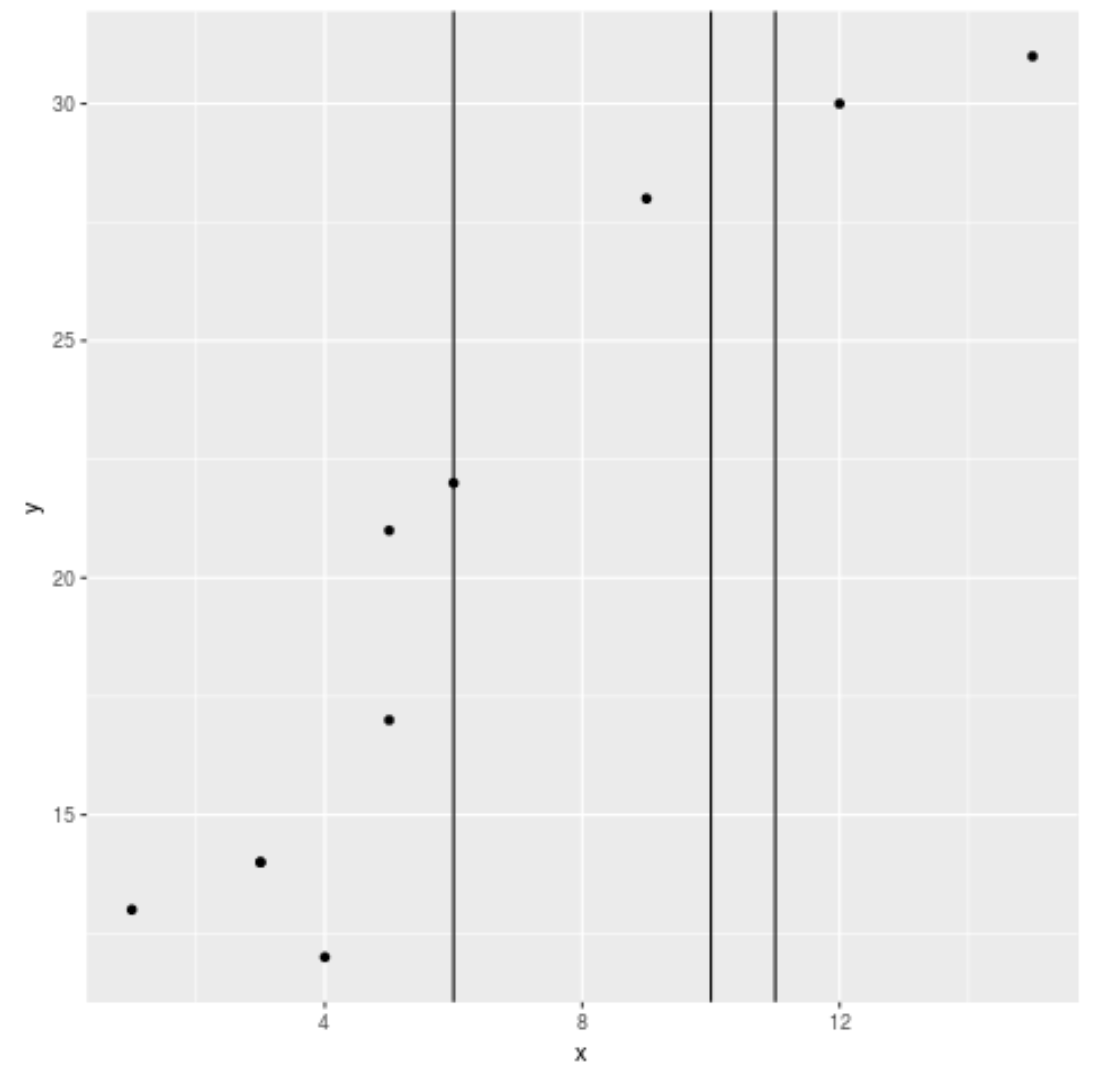
လမ်းကြောင်းများသို့ ဒေါင်လိုက်မျဉ်းများစွာ ထည့်ပါ။
အောက်ပါကုဒ်သည် လမ်းကြောင်းတစ်ခုသို့ ဒေါင်လိုက်လိုင်းများစွာကို ထည့်သွင်းနည်းကို ပြသသည်-
 library (ggplot2)

#create data frame
df <- data.frame(x=c(1, 3, 3, 4, 5, 5, 6, 9, 12, 15),
                 y=c(13, 14, 14, 12, 17, 21, 22, 28, 30, 31))

#create scatterplot with vertical line at x=6, 10, and 11
ggplot(df, aes (x=x, y=y)) +
  geom_point() +
  geom_vline(xintercept=c( 6, 10, 11 ))
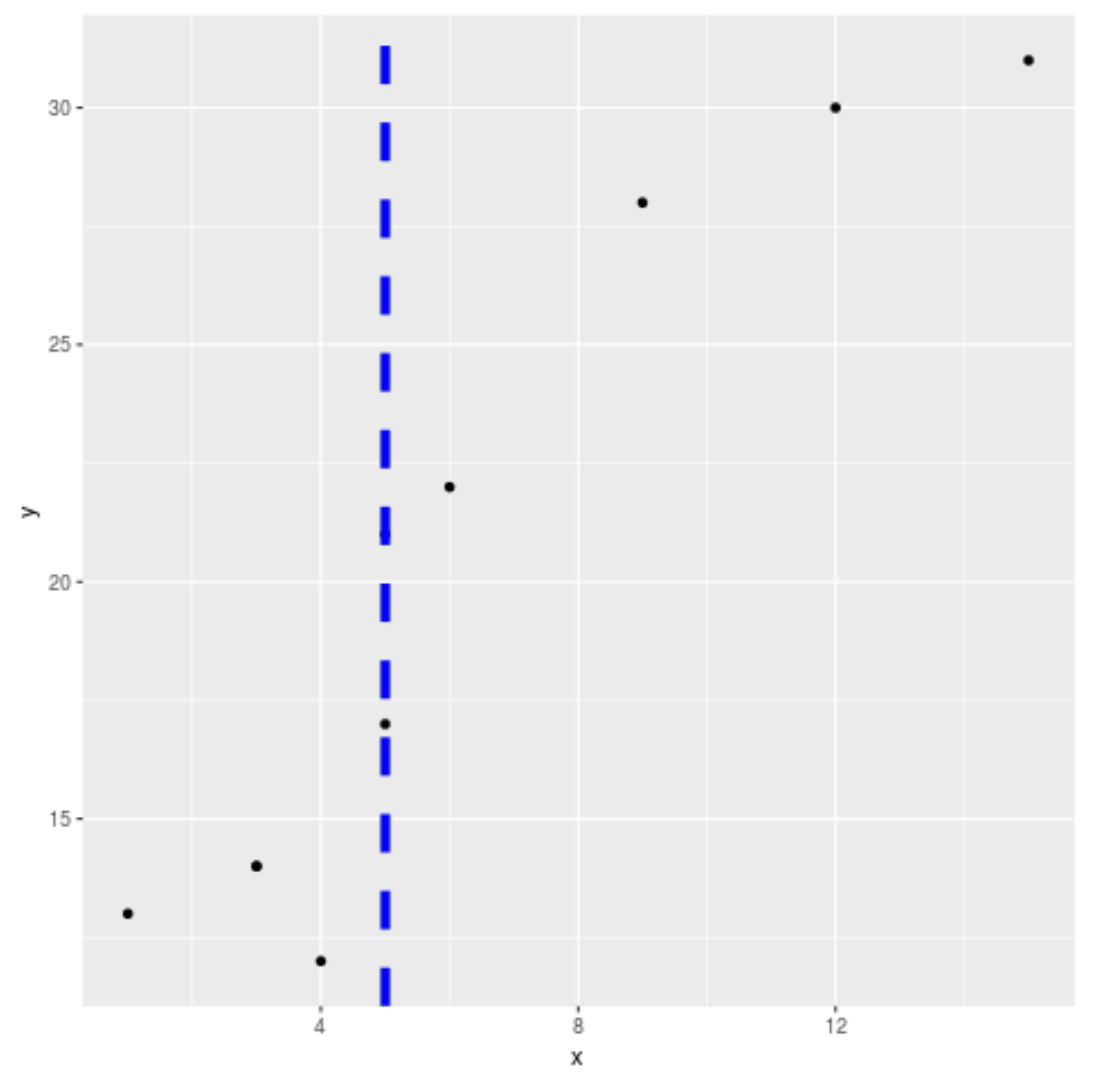
ဒေါင်လိုက်လိုင်းများကို စိတ်ကြိုက်လုပ်ပါ။
အောက်ပါကုဒ်သည် လမ်းကြောင်းတစ်ခုပေါ်တွင် ဒေါင်လိုက်လိုင်းများကို စိတ်ကြိုက်ပြင်ဆင်နည်းကို ပြသသည်-
 library (ggplot2)

#create data frame
df <- data.frame(x=c(1, 3, 3, 4, 5, 5, 6, 9, 12, 15),
                 y=c(13, 14, 14, 12, 17, 21, 22, 28, 30, 31))

#create scatterplot with customized vertical line
ggplot(df, aes (x=x, y=y)) +
  geom_point() +
  geom_vline(xintercept= 5 , linetype=' dashed ', color=' blue ', size =2 )
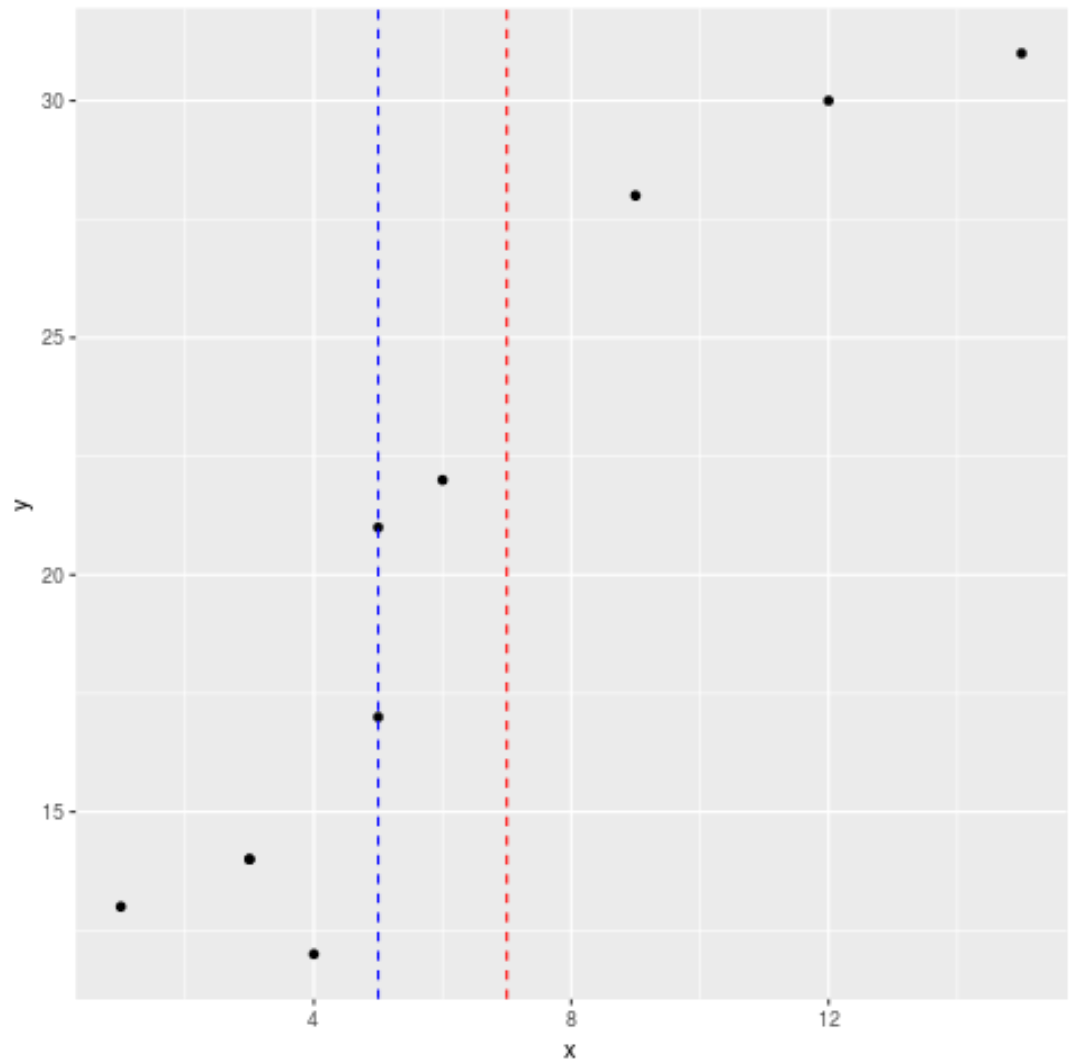
သင့်တွင် ဇယားကွက်တစ်ခုတွင် ဒေါင်လိုက်မျဉ်းများစွာရှိပါက၊ လိုင်းတစ်ခုစီအတွက် ထူးခြားသောအရောင်ကို သင်သတ်မှတ်နိုင်သည်-
 library (ggplot2)

#create data frame
df <- data.frame(x=c(1, 3, 3, 4, 5, 5, 6, 9, 12, 15),
                 y=c(13, 14, 14, 12, 17, 21, 22, 28, 30, 31))

#create scatterplot with customized vertical lines
ggplot(df, aes (x=x, y=y)) +
  geom_point() +
  geom_vline(xintercept=c( 5,7 ) , linetype=' dashed ', color=c(' blue ', ' red '))
ထပ်လောင်းအရင်းအမြစ်များ
အောက်ဖော်ပြပါ သင်ခန်းစာများသည် ggplot2 တွင် အခြားဘုံအလုပ်များကို မည်သို့လုပ်ဆောင်ရမည်ကို ရှင်းပြသည်-
ggplot2 တွင် linear regression line ကို ဘယ်လိုဆွဲမလဲ။
ggplot2 တွင် ဝင်ရိုးကန့်သတ်ချက်များကို မည်သို့သတ်မှတ်မည်နည်း။
ggplot2 တွင် ဘေးချင်းကပ်ကွက်များ ဖန်တီးနည်း
စာရေးသူအကြောင်း
Benjamin Anderson
မင်္ဂလာပါ၊ ကျွန်ုပ်သည် အငြိမ်းစား စာရင်းအင်း ပါမောက္ခ ဘင်ဂျမင်ဖြစ်ပြီး သီးသန့် Statorials ဆရာအဖြစ် လှည့်ပတ်ပါသည်။ စာရင်းဇယားနယ်ပယ်တွင် ကျယ်ပြန့်သောအတွေ့အကြုံနှင့် ကျွမ်းကျင်မှုနှင့်အတူ၊ Statorials မှတစ်ဆင့် ကျောင်းသားများကို ခွန်အားဖြစ်စေရန်အတွက် ကျွန်ုပ်၏အသိပညာကို မျှဝေလိုပါသည်။ ပိုသိတယ်။