Hjust ကိုအသုံးပြုနည်းနှင့် ggplot2 တွင်ဒြပ်စင်များကိုရွှေ့ပါ။
ggplot2 တွင် ဒြပ်စင်များကို အလျားလိုက်နှင့် ဒေါင်လိုက် အသီးသီးရွှေ့ရန် hjust နှင့် vjust အငြင်းအခုံများကို အသုံးပြုနိုင်သည်။
အောက်ပါဥပမာများသည် မတူညီသောအခြေအနေများတွင် hjust နှင့် vjust ကို အသုံးပြုပုံကိုပြသထားသည်။
ဥပမာ 1- ggplot2 တွင် ခေါင်းစဉ်အနေအထားကို ရွှေ့ပါ။
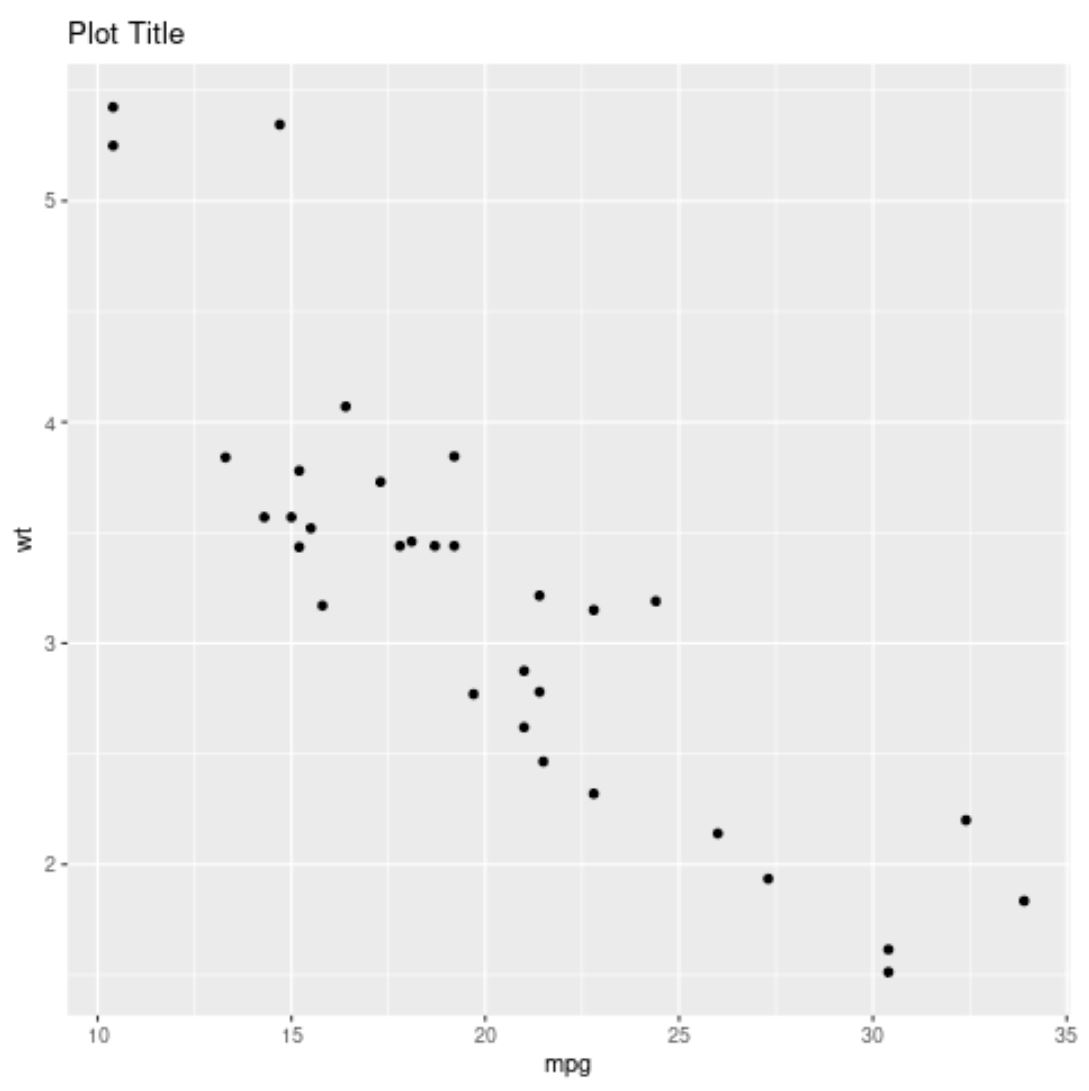
အောက်ပါကုဒ်သည် ပုံသေအနေအထားတွင် ခေါင်းစဉ်တစ်ခုဖြင့် ggplot2 တွင် scatterplot ဖန်တီးနည်းကို ပြသည် (ဘယ်သို့ ညှိထားသည်)။
 library (ggplot2)

#create scatter plot with title in default position
ggplot(data=mtcars, aes(x=mpg, y=wt)) +
  geom_point() +
  ggtitle(" Plot Title ")
အောက်ဖော်ပြပါ ကုဒ်သည် hjust=0.5 ကို အသုံးပြု၍ ခေါင်းစဉ်ကို အလယ်ဗဟိုပြုနည်းကို ပြသသည် ။
 library (ggplot2)

#create scatter plot with title center-aligned
ggplot(data=mtcars, aes(x=mpg, y=wt)) +
  geom_point() +
  ggtitle(" Plot Title ") +
  theme(plot. title = element_text(hjust= .5 ))
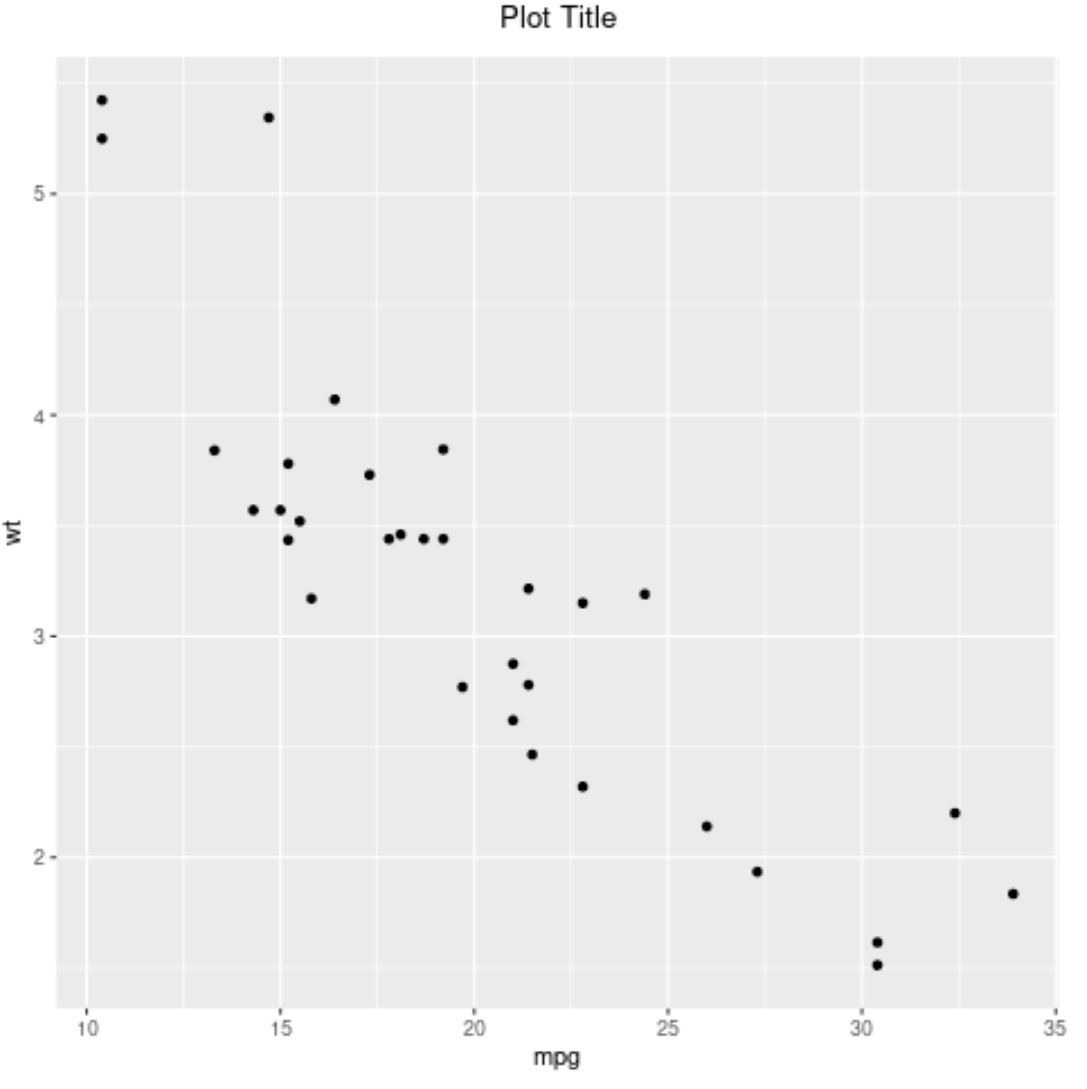
မှတ်ချက် – ခေါင်းစဉ်ကို ညာဘက်သို့ချိန်ညှိရန် hjust=1 ကိုလည်း သုံးနိုင်သည်။
ဥပမာ 2- ggplot2 တွင် ဝင်ရိုးအညွှန်းတည်နေရာကို ရွှေ့ပါ။
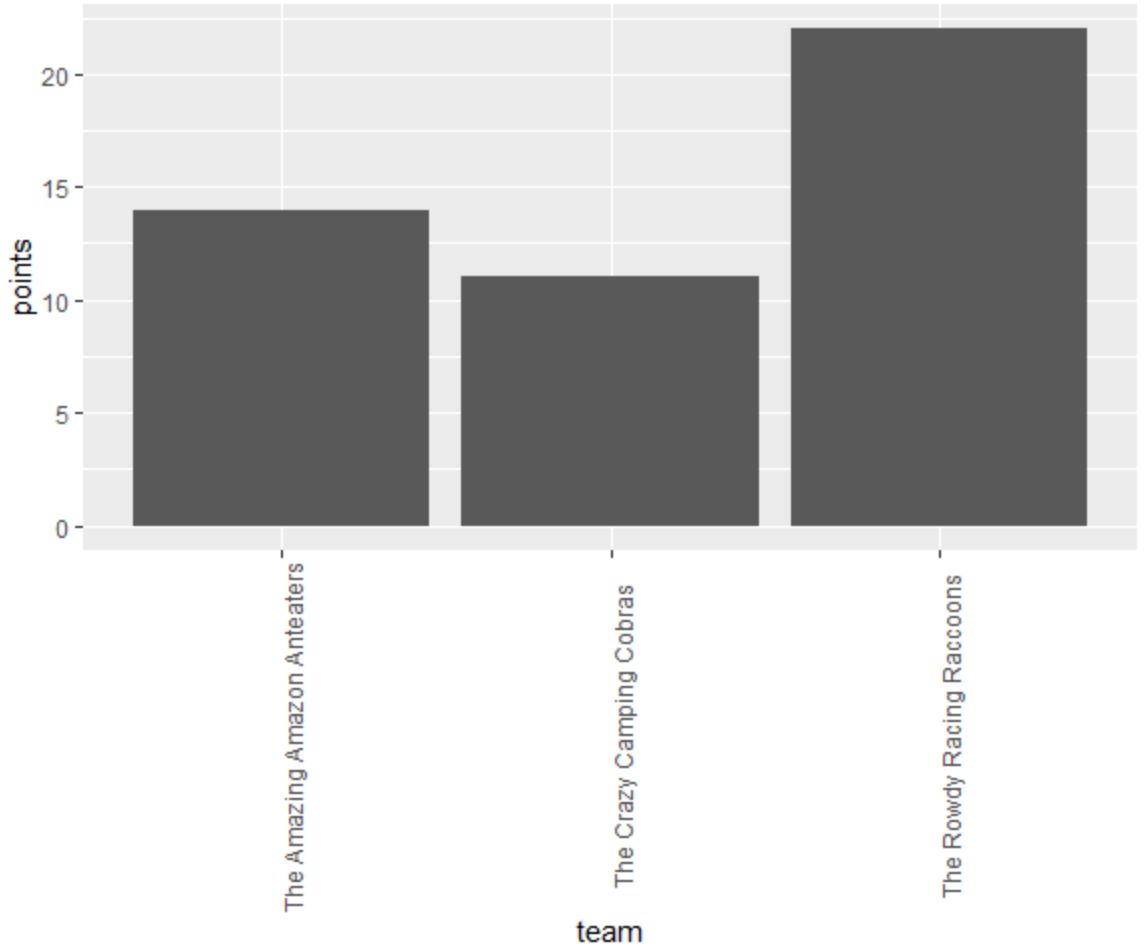
အောက်ပါကုဒ်သည် ၎င်းတို့ကိုဖတ်ရလွယ်ကူစေရန် ggplot2 တွင် x-axis အညွှန်းများကို 90 ဒီဂရီလှည့်ပတ်ထားသည့် ဘားဇယားတစ်ခုဖန်တီးပုံကို ပြသသည်-
 library (ggplot2)

#create data frame
df = data. frame (team=c('The Amazing Amazon Anteaters',
                       'The Rowdy Racing Raccoons',
                       'The Crazy Camping Cobras'),
                dots=c(14, 22, 11))

#create bar plot to visualize points scored by each team
ggplot(data=df, aes(x=team, y=points)) +
  geom_bar(stat=' identity ') +
  theme(axis. text . x = element_text(angle= 90 ))
x-axis အညွှန်းများကို ချိန်ညှိရန် hjust နှင့် vjust အကြောင်းပြချက်များကို အသုံးပြု၍ ၎င်းတို့သည် x-axis အမှတ်အသားများနှင့် ပိုမိုနီးကပ်စွာ ချိန်ညှိနိုင်သည်-
 library (ggplot2)

#create data frame
df = data. frame (team=c('The Amazing Amazon Anteaters',
                       'The Rowdy Racing Raccoons',
                       'The Crazy Camping Cobras'),
                dots=c(14, 22, 11))

#create bar plot to visualize points scored by each team
ggplot(data=df, aes(x=team, y=points)) +
  geom_bar(stat=' identity ') +
  theme(axis. text . x = element_text(angle= 90 , vjust= .5 , hjust= 1 )

ဥပမာ 3- ggplot2 တွင် စာသားအနေအထားကို ရွှေ့ပါ။
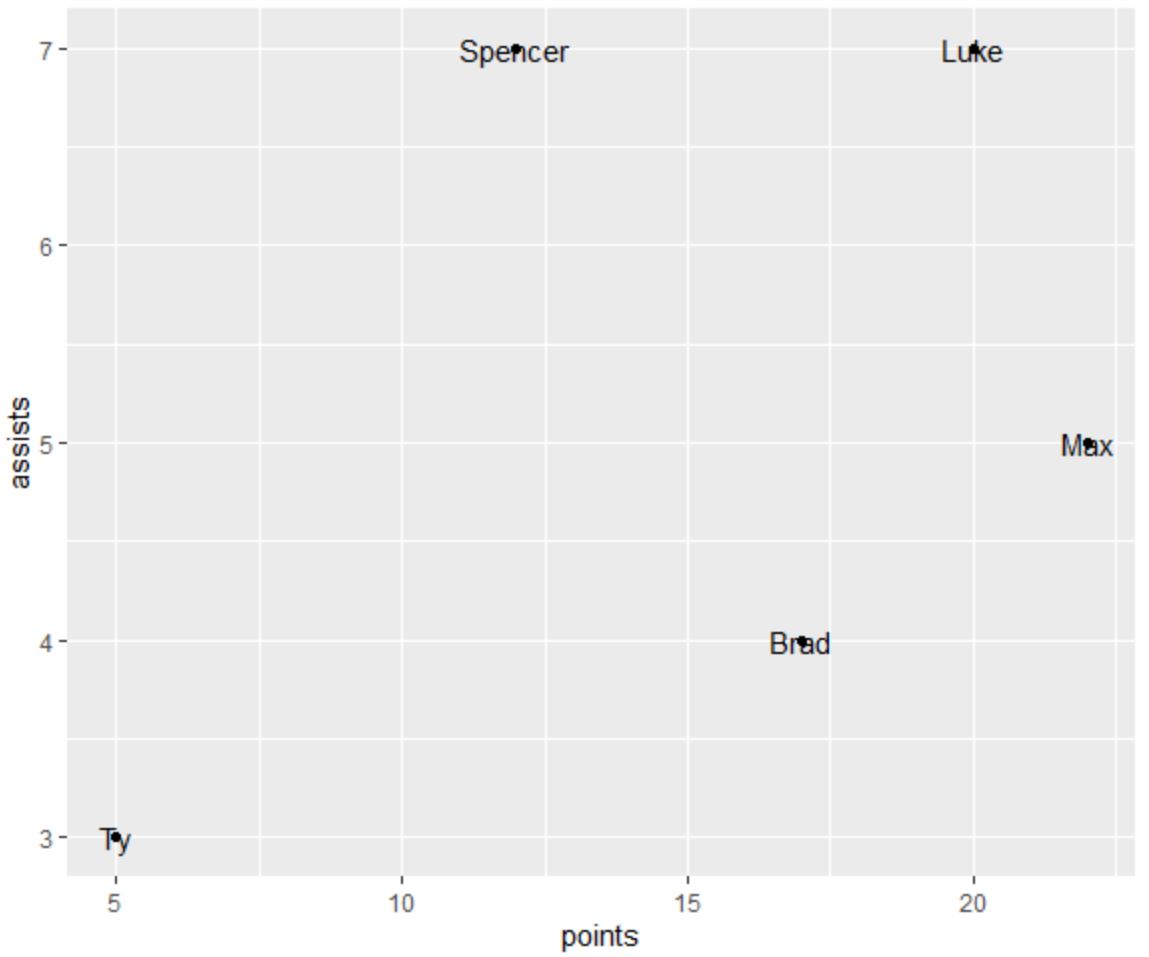
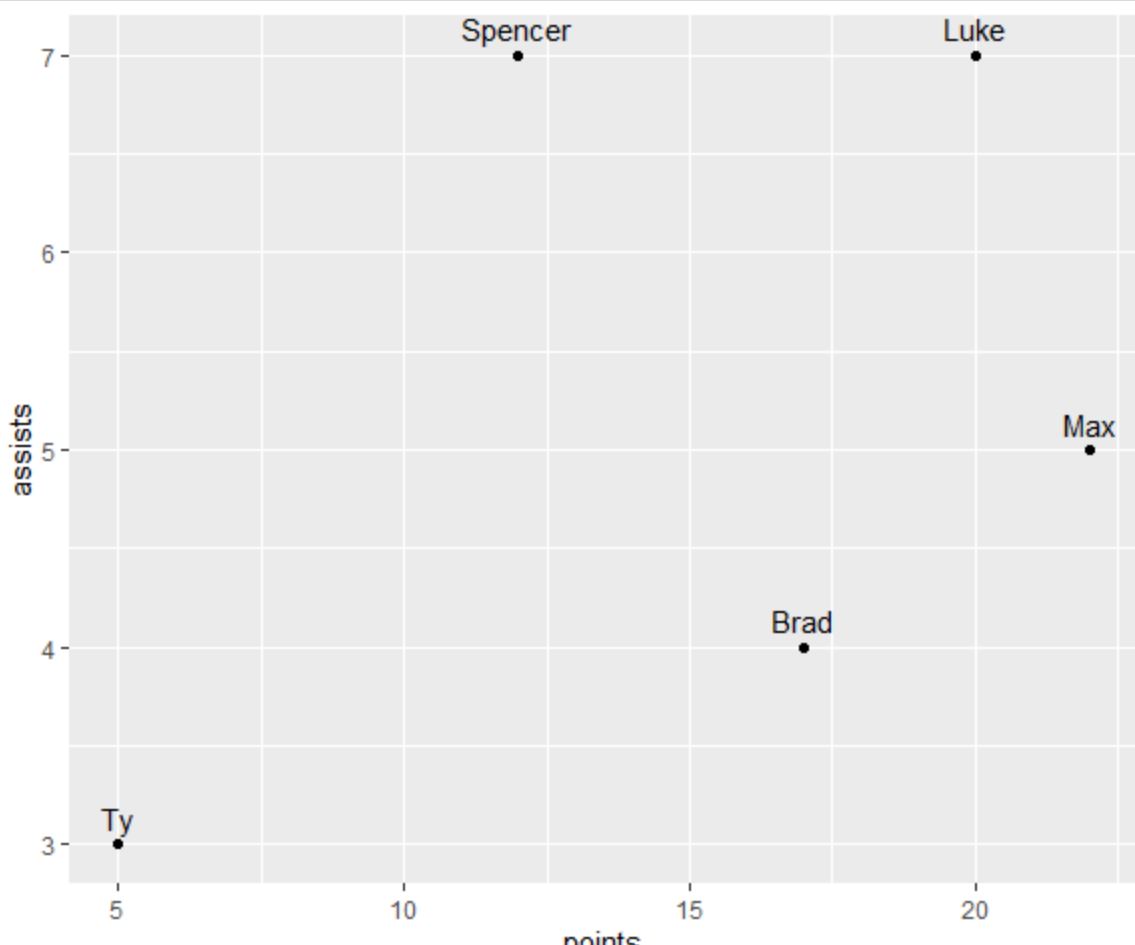
အောက်ဖော်ပြပါ ကုဒ်သည် ကွက်ကွက်ရှိ အမှတ်တစ်ခုစီအတွက် အမှတ်အသားပြုထားသော စာသားဖြင့် ggplot2 တွင် scatterplot တစ်ခုကို ဖန်တီးနည်းကို ပြသည်-
 library (ggplot2)

#create data frame
df <- data. frame (player=c('Brad', 'Ty', 'Spencer', 'Luke', 'Max'),
                 dots=c(17, 5, 12, 20, 22),
                 assists=c(4, 3, 7, 7, 5))

#create scatter plot with annotated labels
ggplot(df) +
  geom_point(aes(x=points, y=assists)) +
  geom_text(aes(x=points, y=assists, label=player))
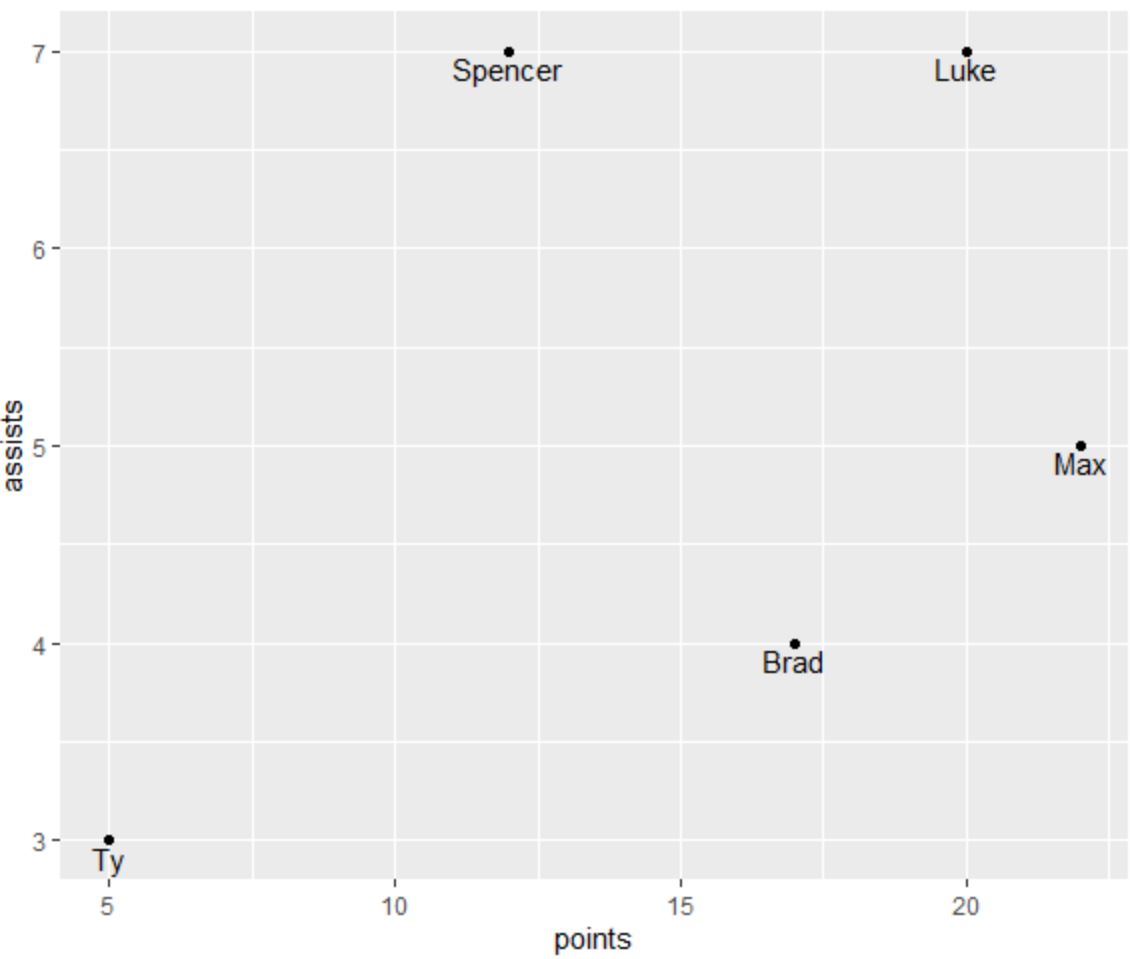
စာသားဒြပ်စင်များကို ဒေါင်လိုက်ရွှေ့ရန် vjust အငြင်းအခုံကို အသုံးပြု၍ ၎င်းတို့ကို ပိုမိုလွယ်ကူစွာ ဖတ်နိုင်စေရန်၊
 library (ggplot2)

#create data frame
df <- data. frame (player=c('Brad', 'Ty', 'Spencer', 'Luke', 'Max'),
                 dots=c(17, 5, 12, 20, 22),
                 assists=c(4, 3, 7, 7, 5))

#create scatter plot with annotated labels
ggplot(df) +
  geom_point(aes(x=points, y=assists)) +
  geom_text(aes(x=points, y=assists, label=player), vjust= -.6 )
စာသားဒြပ်စင်များကို ဒေါင်လိုက်အောက်သို့ ရွှေ့ရန် vjust အတွက် အပြုသဘောတန်ဖိုးကိုလည်း အသုံးပြုနိုင်သည်။
 library (ggplot2)

#create data frame
df <- data. frame (player=c('Brad', 'Ty', 'Spencer', 'Luke', 'Max'),
                 dots=c(17, 5, 12, 20, 22),
                 assists=c(4, 3, 7, 7, 5))

#create scatter plot with annotated labels
ggplot(df) +
  geom_point(aes(x=points, y=assists)) +
  geom_text(aes(x=points, y=assists, label=player), vjust= 1.2 )
အမှတ်အသားပြုထားသော စာသားသည် ယခုအခါ ကွက်ကွက်ပေါ်ရှိ အမှတ်တစ်ခုစီ၏အောက်တွင် တည်ရှိနေပါသည်။
ထပ်လောင်းအရင်းအမြစ်များ
အောက်ဖော်ပြပါ သင်ခန်းစာများသည် ggplot2 တွင် အခြားဘုံအလုပ်များကို မည်သို့လုပ်ဆောင်ရမည်ကို ရှင်းပြသည်-
ggplot2 တွင်ဒဏ္ဍာရီခေါင်းစဉ်ကိုဘယ်လိုပြောင်းမလဲ။
ggplot2 တွင် ဝင်ရိုးတံဆိပ်များကို လှည့်နည်း
R တွင် ပြင်ဆင်နည်း- function “ ggplot” ကို ရှာမတွေ့ပါ။
စာရေးသူအကြောင်း
Benjamin Anderson
မင်္ဂလာပါ၊ ကျွန်ုပ်သည် အငြိမ်းစား စာရင်းအင်း ပါမောက္ခ ဘင်ဂျမင်ဖြစ်ပြီး သီးသန့် Statorials ဆရာအဖြစ် လှည့်ပတ်ပါသည်။ စာရင်းဇယားနယ်ပယ်တွင် ကျယ်ပြန့်သောအတွေ့အကြုံနှင့် ကျွမ်းကျင်မှုနှင့်အတူ၊ Statorials မှတစ်ဆင့် ကျောင်းသားများကို ခွန်အားဖြစ်စေရန်အတွက် ကျွန်ုပ်၏အသိပညာကို မျှဝေလိုပါသည်။ ပိုသိတယ်။