Seaborn barplot တွင် ဘားများ၏ အစီအစဥ်ကို ပြောင်းလဲနည်း
အဏ္ဏဝါ ကွက်တစ်ခုတွင် ဘားများ၏ အစီအစဥ်ကို ပြောင်းလဲရန် အောက်ပါနည်းလမ်းများကို အသုံးပြုနိုင်သည်။
နည်းလမ်း 1- ဒေတာစိမ်းမှ ဖန်တီးထားသော Barplot တွင် ဘားများကို စီရန်
sns. barplot (x=' xvar ', y=' yvar ', data=df, order=df. sort_values (' yvar '). xvar )
နည်းလမ်း 2- စုစည်းထားသောဒေတာမှ ဖန်တီးထားသော Barplot တွင် ဘားများကိုစီရန်
sns. barplot (x=' xvar ', y=' yvar ', data=df, order=df_agg[' xvar ']
အောက်ဖော်ပြပါ ဥပမာများသည် နည်းလမ်းတစ်ခုစီကို လက်တွေ့အသုံးချနည်းကို ပြသထားသည်။
ဥပမာ 1- ဒေတာစိမ်းမှ ဖန်တီးထားသော Barplot တွင် ဘားများကို စီရန်
ကုမ္ပဏီတစ်ခု၏ ဝန်ထမ်းအမျိုးမျိုးမှ ရောင်းချသည့် စုစုပေါင်းရောင်းချမှုဆိုင်ရာ အချက်အလက်များပါရှိသော အောက်ပါပန်ဒါ DataFrame ရှိသည်ဆိုပါစို့။
 import pandas as pd

#createDataFrame
df = pd. DataFrame ({' employee ': ['Andy', 'Bert', 'Chad', 'Doug', 'Eric', 'Frank'],
                   ' sales ': [22, 14, 9, 7, 29, 20]})

#view DataFrame
print (df)

  employee sales
0 Andy 22
1 Bert 14
2 Chad 9
3 Doug 7
4 Eric 29
5 Frank 20
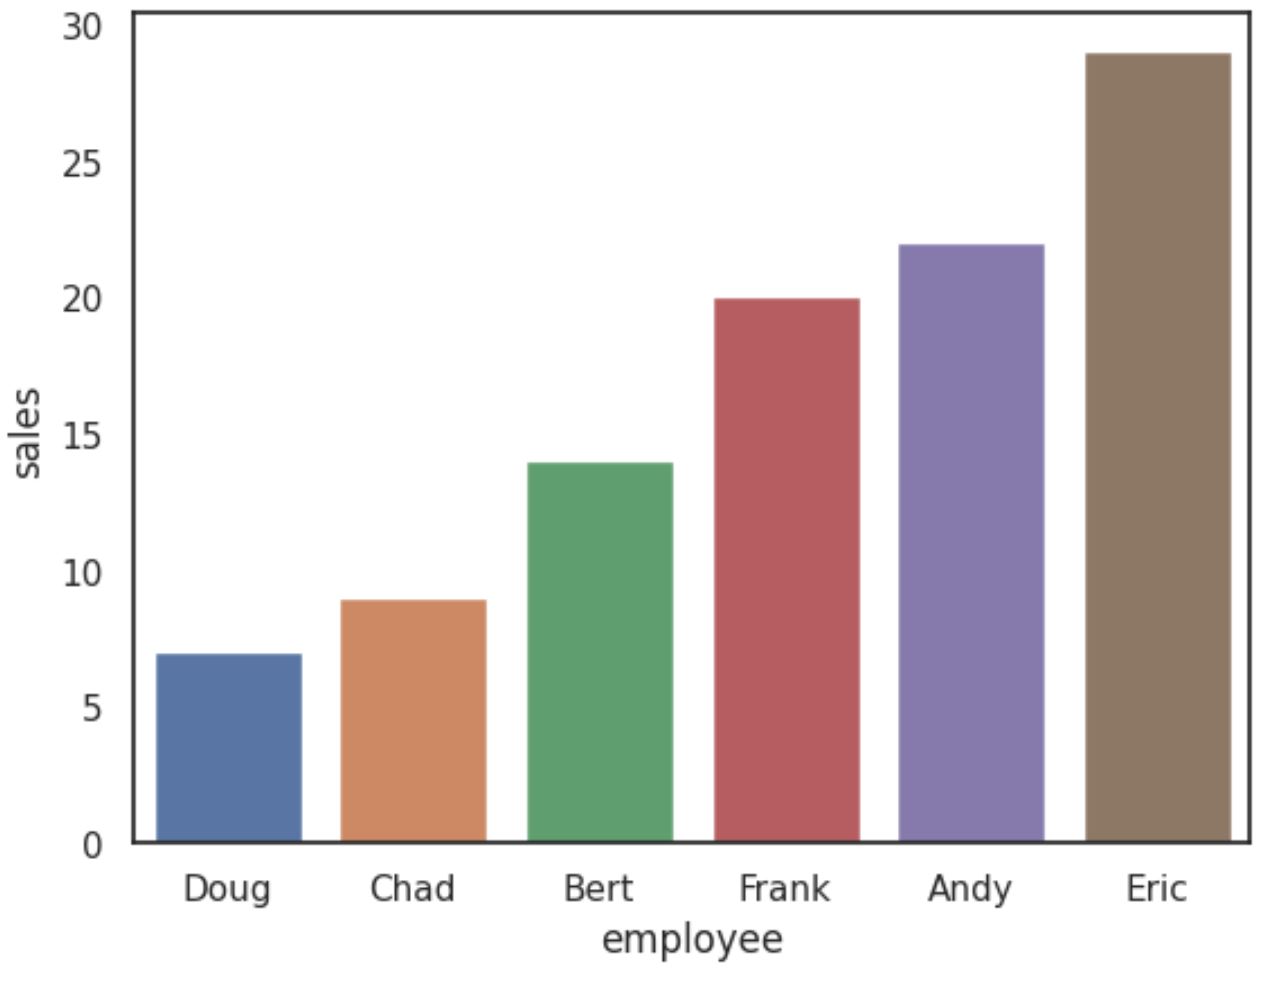
အရောင်း တန်ဖိုးအပေါ် အခြေခံ၍ ဘားများကို ကြီးကြီးလိုက် စီခွဲထားသည့် barplot တစ်ခုကို ဖန်တီးရန် အောက်ပါ syntax ကို အသုံးပြုနိုင်ပါသည်။
 import seaborn as sns

#create barplot with bars sorted by sales values ascending
sns. barplot (x=' employee ', y=' sales ', data=df, order=df. sort_values (' sales '). employee )
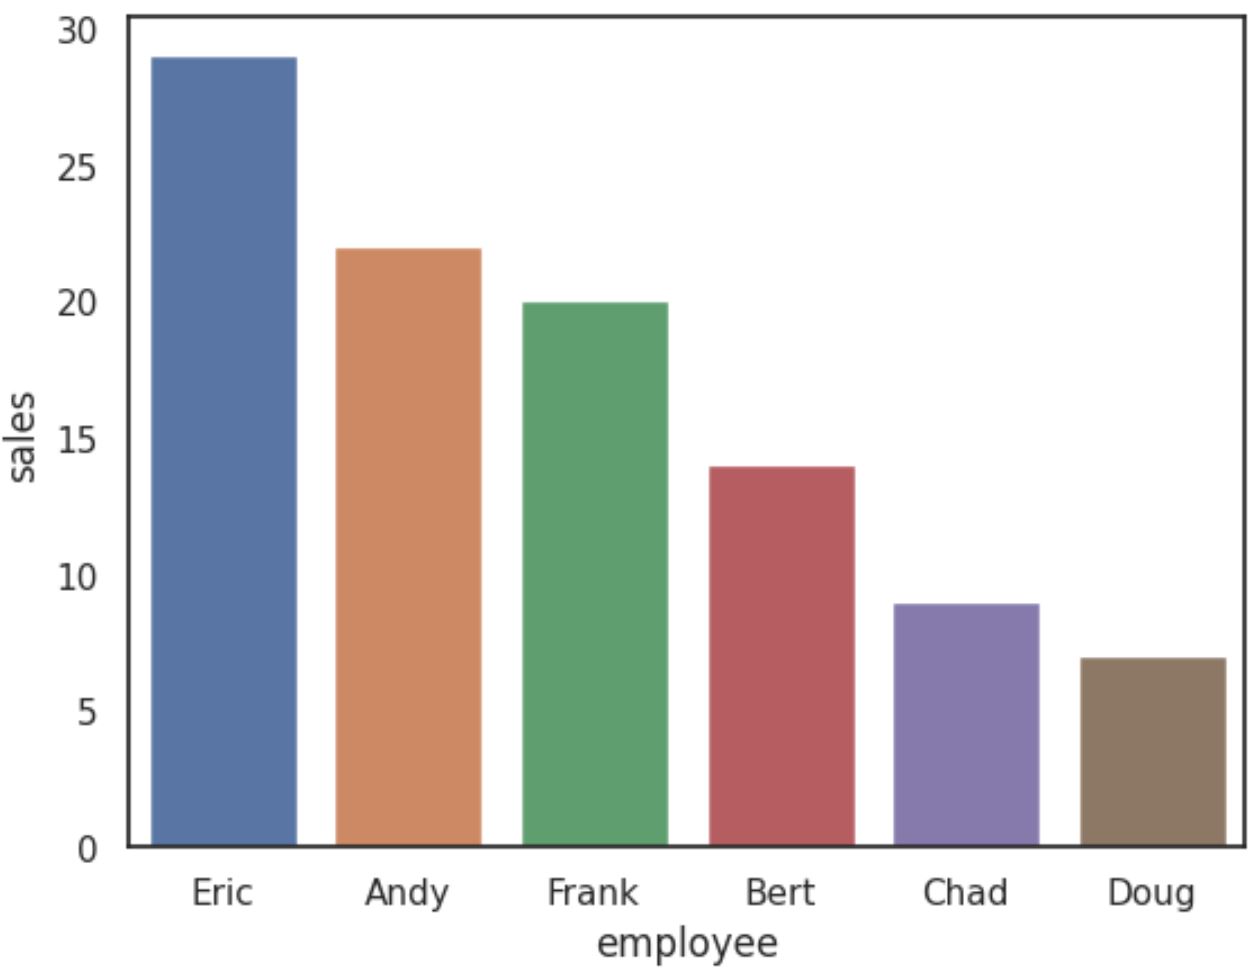
ဘားများကို ကြီးစဉ်ငယ်လိုက် စီရန်၊ sort_values() လုပ်ဆောင်ချက်တွင် ascending=False ကို အသုံးပြုပါ။
 import seaborn as sns

#create barplot with bars sorted by sales values descending
sns. barplot (x=' employee ', y=' sales ', data=df,
            order=df. sort_values (' sales ', ascending= False ). employee )
ဥပမာ 2- စုစည်းထားသောဒေတာမှ ဖန်တီးထားသော Barplot တွင် ဘားများကိုစီရန်
ကုမ္ပဏီတစ်ခု၏ ဝန်ထမ်းအမျိုးမျိုးမှ ရောင်းချသည့် စုစုပေါင်းရောင်းချမှုဆိုင်ရာ အချက်အလက်များပါရှိသော အောက်ပါပန်ဒါ DataFrame ရှိသည်ဆိုပါစို့။
 import pandas as pd

#createDataFrame
df = pd. DataFrame ({' employee ': ['A', 'A', 'A', 'B', 'B', 'B', 'C', 'C', 'C'],
                   ' sales ': [24, 20, 25, 14, 19, 13, 30, 35, 28]})

#view DataFrame
print (df)

  employee sales
0 to 24
1 to 20
2 to 25
3 B 14
4 B 19
5 B 13
6 C 30
7 C 35
8 C 28
ဝန်ထမ်း အလိုက် အုပ်စုဖွဲ့ထားသော ပျမ်းမျှ ရောင်းအား တန်ဖိုးကို တွက်ချက်ရန် အောက်ပါ syntax ကို အသုံးပြုနိုင်ပါသည်။
 #calculate mean sales by employee
df_agg = df. groupby ([' employee '])[' sales ']. mean (). reset_index (). sort_values (' sales ')

#view aggregated data
print (df_agg)

  employee sales
1 B 15.333333
0 to 23.000000
2 C 31.000000
ထို့နောက် ဝန်ထမ်းတစ်ဦးလျှင် ပျမ်းမျှရောင်းအားကို ပြသသည့် barplot ကို ကြီးစဉ်ငယ်လိုက် ဖော်ပြသည့် seaborn တွင် အောက်ဖော်ပြပါ syntax ကို သုံးနိုင်သည်-
 import seaborn as sns

#create barplot with bars ordered in ascending order by mean sales
sns. barplot (x=' employee ', y=' sales ', data=df,
            order=df_agg[' employee '], errorbar=(' ci ', False ))
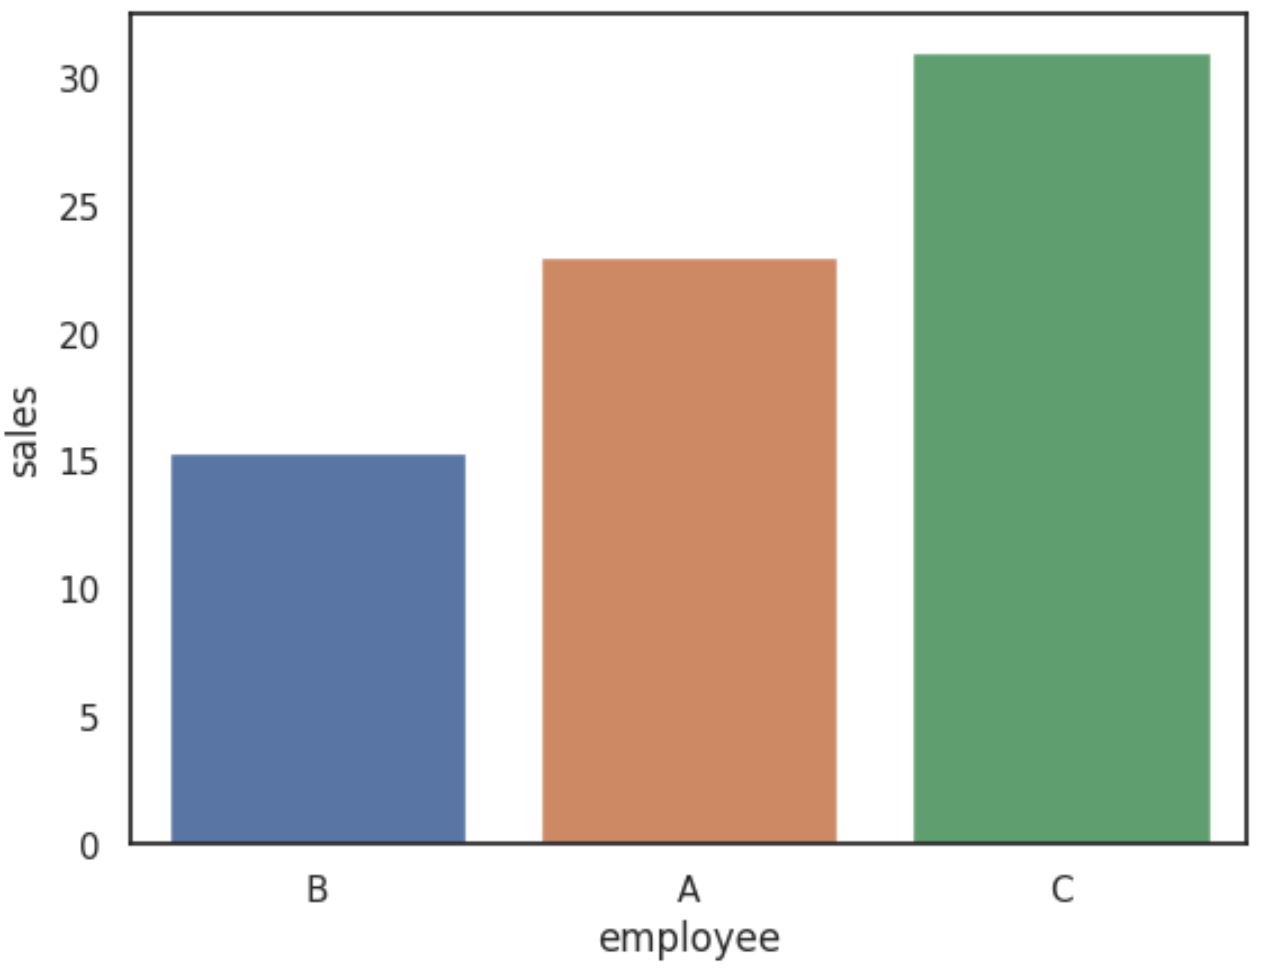
X-axis သည် ဝန်ထမ်း၏အမည်ကိုပြသပြီး Y-axis သည် ဝန်ထမ်းတစ်ဦးစီအတွက် ပျမ်းမျှအရောင်းတန်ဖိုးကိုပြသသည်။
ထပ်လောင်းအရင်းအမြစ်များ
အောက်ဖော်ပြပါ သင်ခန်းစာများသည် ပင်လယ်မွေးတွင် အခြားဘုံလုပ်ဆောင်ချက်များကို မည်သို့လုပ်ဆောင်ရမည်ကို ရှင်းပြသည်-
Seaborn Barplot တွင် တန်ဖိုးများပြသနည်း
Seaborn တွင် အုပ်စုဖွဲ့ barplot တစ်ခုကို ဖန်တီးနည်း
Seaborn barplot တွင်ဘားများ၏အရောင်သတ်မှတ်နည်း
စာရေးသူအကြောင်း
Benjamin Anderson
မင်္ဂလာပါ၊ ကျွန်ုပ်သည် အငြိမ်းစား စာရင်းအင်း ပါမောက္ခ ဘင်ဂျမင်ဖြစ်ပြီး သီးသန့် Statorials ဆရာအဖြစ် လှည့်ပတ်ပါသည်။ စာရင်းဇယားနယ်ပယ်တွင် ကျယ်ပြန့်သောအတွေ့အကြုံနှင့် ကျွမ်းကျင်မှုနှင့်အတူ၊ Statorials မှတစ်ဆင့် ကျောင်းသားများကို ခွန်အားဖြစ်စေရန်အတွက် ကျွန်ုပ်၏အသိပညာကို မျှဝေလိုပါသည်။ ပိုသိတယ်။