Matplotlib တွင် tight_layout() ကိုအသုံးပြုနည်း
သင်သည် Matplotlib တွင် Tight_layout() လုပ်ဆောင်ချက်ကို အသုံးပြု၍ အပိုင်းခွဲများကြားနှင့် အနီးတစ်ဝိုက်ကြားတွင် ကွက်လပ်များကို အလိုအလျောက်ချိန်ညှိနိုင်သည်။
အောက်ဖော်ပြပါ ဥပမာသည် ဤလုပ်ဆောင်ချက်ကို လက်တွေ့အသုံးချနည်းကို ပြသထားသည်။
ဥပမာ- Matplotlib တွင် Tight_layout() ကိုအသုံးပြုနည်း
2×2 ဇယားကွက်လေးခုဖန်တီးရန် Matplotilb ကိုအသုံးပြုသည်ဆိုပါစို့။
 import matplotlib. pyplot as plt

#define data
x = [1, 2, 3]
y = [7, 13, 24]

#define layout for subplots
fig, ax = plt. subplots (2, 2)

#define subplot titles
ax[0, 0]. plot (x,y,color=' red ')
ax[0, 1]. plot (x,y,color=' blue ')
ax[1, 0]. plot (x,y,color=' green ')
ax[1, 1]. plot (x,y,color=' purple ')

#add title to each subplot
ax[0, 0]. set_title (' First Subplot ')
ax[0, 1]. set_title (' Second Subplot ')
ax[1, 0]. set_title (' Third Subplot ')
ax[1, 1]. set_title (' Fourth Subplot ')
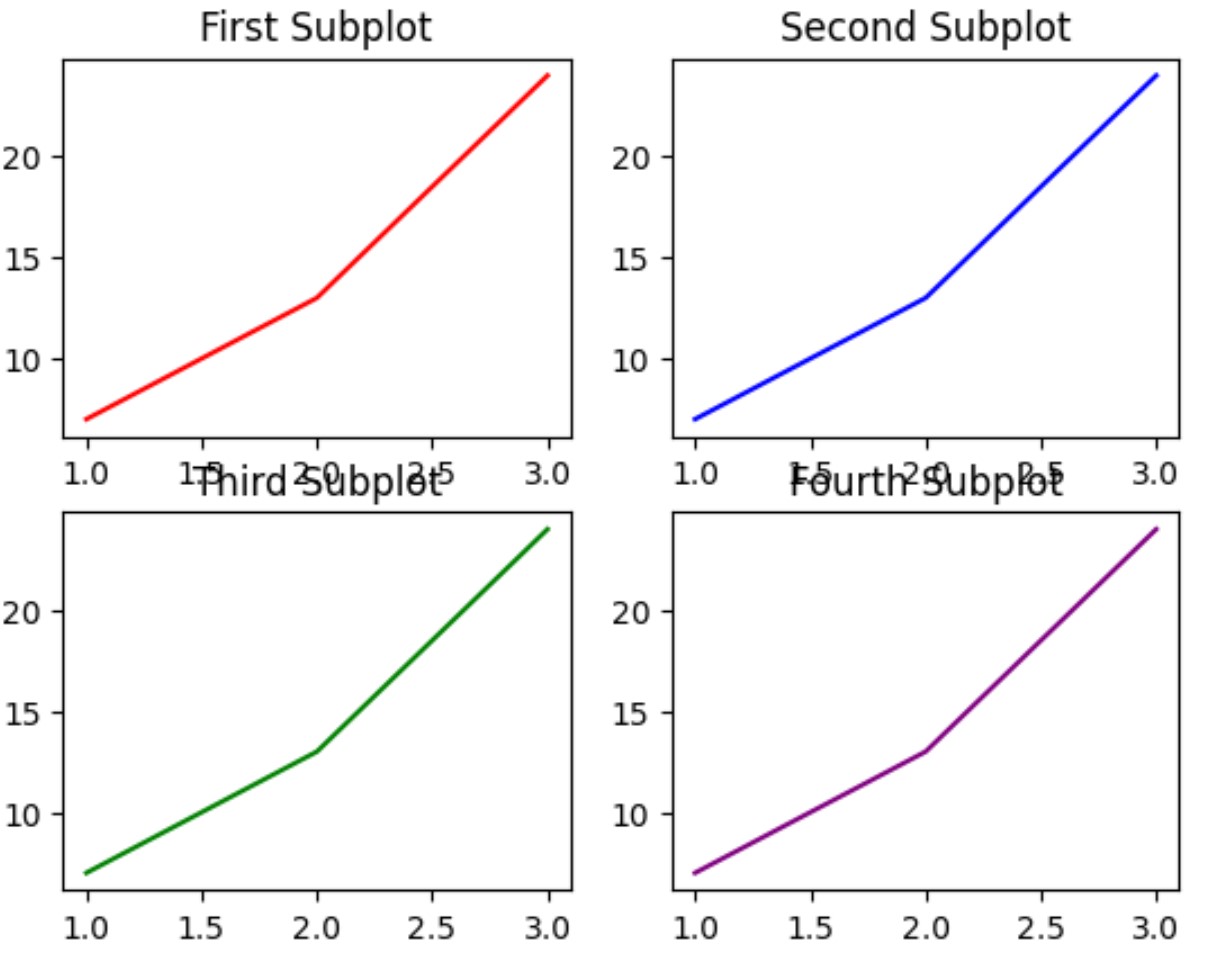
အချို့နေရာများတွင် ခေါင်းစဉ်များ ထပ်နေခြင်းကြောင့် အပိုင်းခွဲများကြားတွင် ကွက်လပ်အနည်းငယ်သာ ရှိသည်ကို သတိပြုပါ။
fig.tight_layout() ကို သတ်မှတ်ခြင်းဖြင့် ကျွန်ုပ်တို့သည် အပိုင်းခွဲများကြားနှင့် အနီးတစ်ဝိုက်ရှိ padding ကို အလိုအလျောက်ချိန်ညှိနိုင်သည်-
 import matplotlib. pyplot as plt

#define data
x = [1, 2, 3]
y = [7, 13, 24]

#define layout for subplots
fig, ax = plt. subplots (2, 2)

#specify a tight layout
fig. tight_layout ()

#define subplot titles
ax[0, 0]. plot (x,y,color=' red ')
ax[0, 1]. plot (x,y,color=' blue ')
ax[1, 0]. plot (x,y,color=' green ')
ax[1, 1]. plot (x,y,color=' purple ')

#add title to each subplot
ax[0, 0]. set_title (' First Subplot ')
ax[0, 1]. set_title (' Second Subplot ')
ax[1, 0]. set_title (' Third Subplot ')
ax[1, 1]. set_title (' Fourth Subplot ')
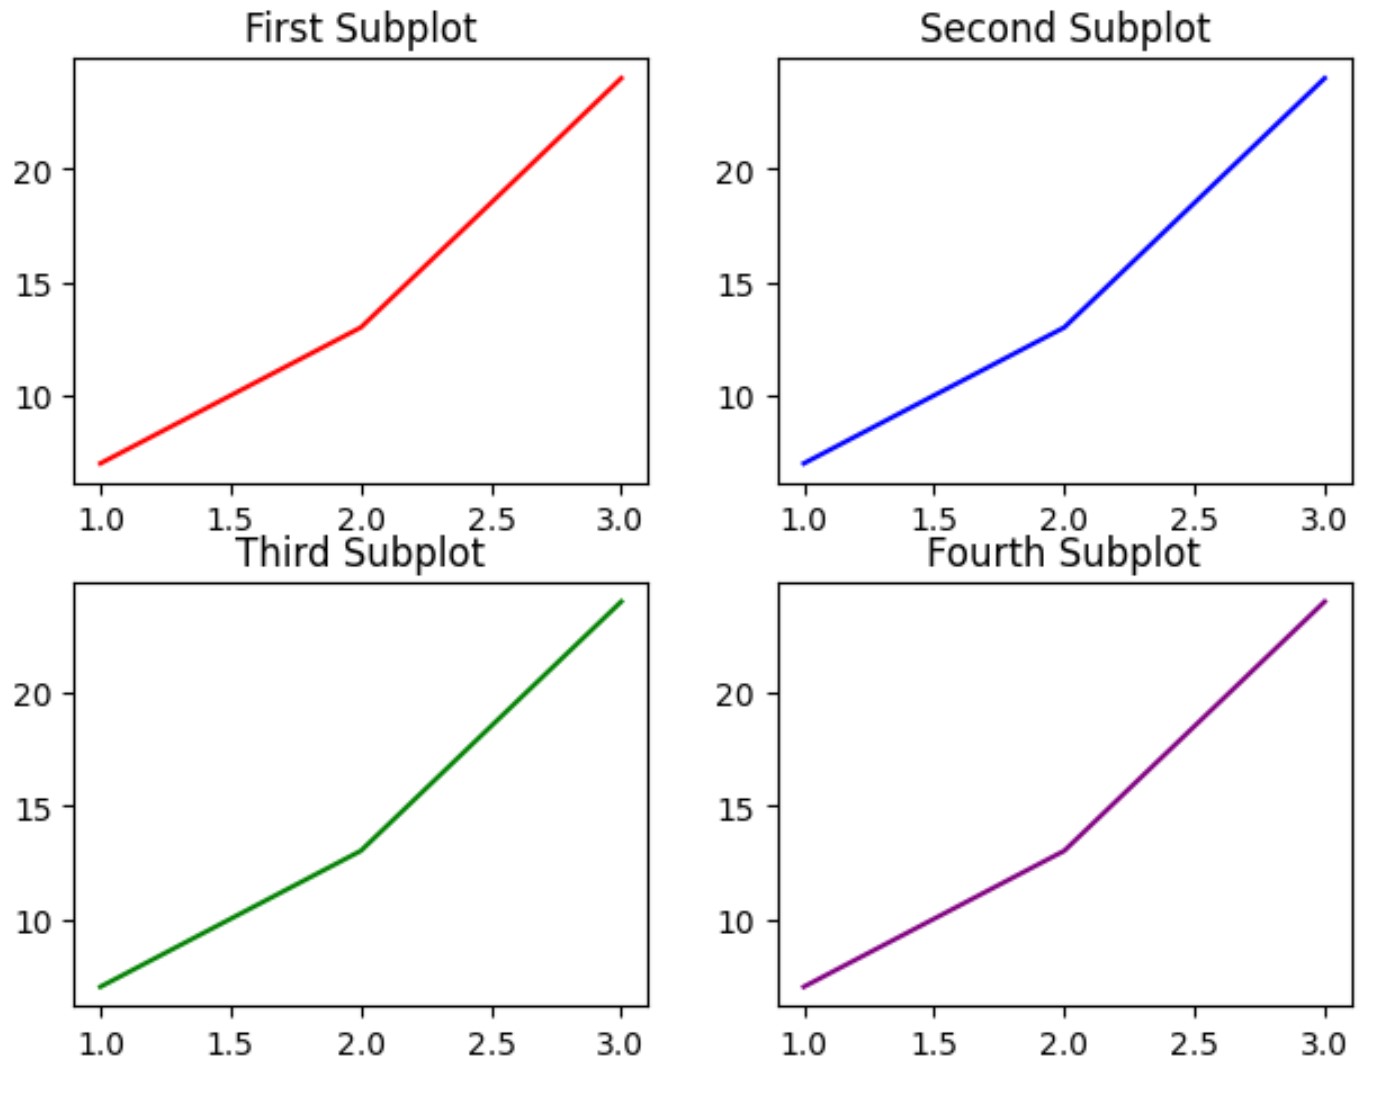
ကွက်လပ်များကြားနှင့် အနီးတစ်ဝိုက်တွင် ကွက်လပ်များကို ချိန်ညှိထားပြီး မည်သည့်ဧရိယာတွင်မဆို ထပ်နေစေရန်အတွက် မြေကွက်များကို ချိန်ညှိထားသည်။
Tight_layout() လုပ်ဆောင်ချက်သည် ဖောင့်အရွယ်အစား၏ အပိုင်းတစ်ပိုင်းအဖြစ် ပုံအစွန်းနှင့် subpath အစွန်းများကြား padding ကို သတ်မှတ်ရန် pad argument တစ်ခုယူသည်ကို သတိပြုပါ။
မူရင်း pad တန်ဖိုးသည် 1.08 ဖြစ်သည်။ သို့သော်၊ လမ်းကြောင်းများတဝိုက်ရှိ padding ကိုတိုးမြှင့်ရန် ဤတန်ဖိုးကို တိုးမြှင့်နိုင်သည်-
 import matplotlib. pyplot as plt

#define data
x = [1, 2, 3]
y = [7, 13, 24]

#define layout for subplots
fig, ax = plt. subplots (2, 2)

#specify a tight layout with increased padding
fig. tight_layout (pad=5)

#define subplot titles
ax[0, 0]. plot (x,y,color=' red ')
ax[0, 1]. plot (x,y,color=' blue ')
ax[1, 0]. plot (x,y,color=' green ')
ax[1, 1]. plot (x,y,color=' purple ')

#add title to each subplot
ax[0, 0]. set_title (' First Subplot ')
ax[0, 1]. set_title (' Second Subplot ')
ax[1, 0]. set_title (' Third Subplot ')
ax[1, 1]. set_title (' Fourth Subplot ')
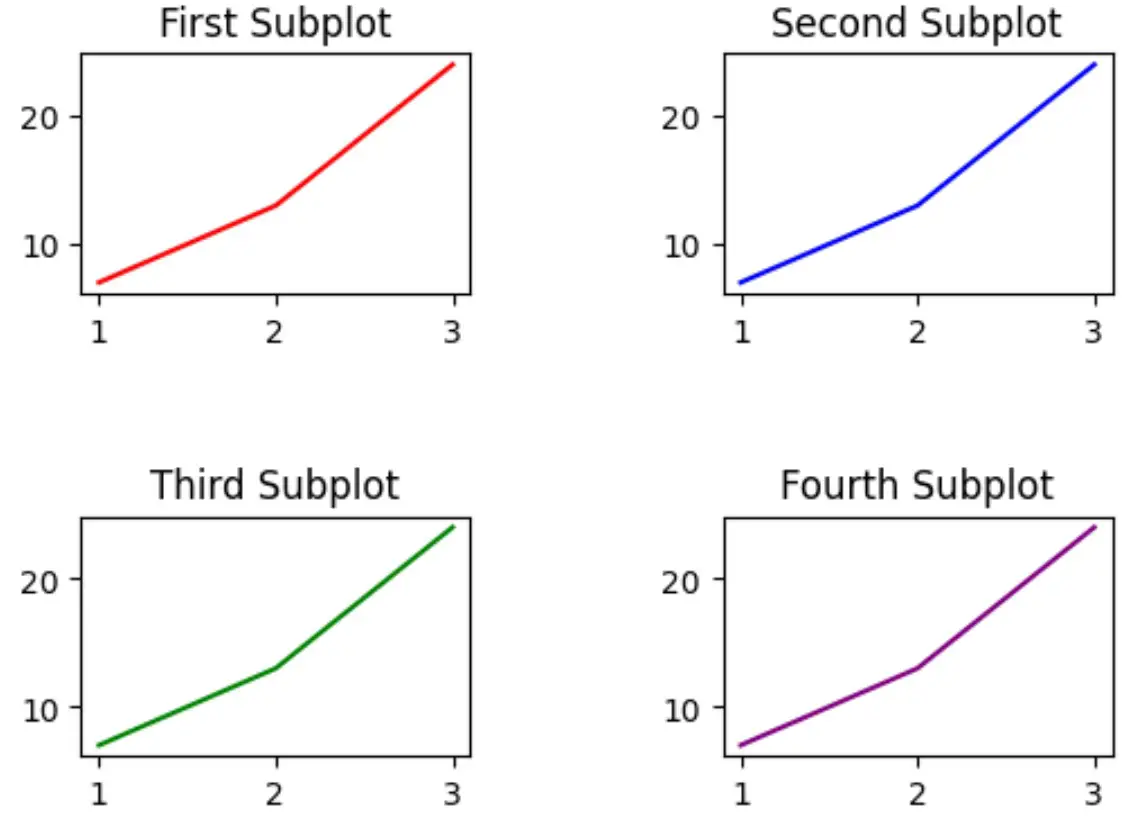
မြေကွက်များအနီးတစ်ဝိုက်တွင် ဖြည့်သွင်းမှုများ သိသိသာသာ မြင့်တက်လာသည်ကို သတိပြုပါ။
သင်နှစ်သက်သလောက် လမ်းများပတ်ပတ်လည်တွင် padding ကိုတိုးမြှင့်ရန်အတွက် pad argument ၏တန်ဖိုးကို ချိန်ညှိရန် အားမနာပါ။
ထပ်လောင်းအရင်းအမြစ်များ
အောက်ပါသင်ခန်းစာများသည် Matplotlib ရှိ အခြားဘုံအလုပ်များကို မည်သို့လုပ်ဆောင်ရမည်ကို ရှင်းပြသည်-
Matplotlib တွင် ခေါင်းစဉ်ခွဲများ မည်သို့ထည့်မည်နည်း။
Matplotlib ရှိ subplot အရွယ်အစားကို ချိန်ညှိနည်း
Matplotlib အပိုင်းခွဲများကြား အကွာအဝေးကို ချိန်ညှိနည်း
စာရေးသူအကြောင်း
Benjamin Anderson
မင်္ဂလာပါ၊ ကျွန်ုပ်သည် အငြိမ်းစား စာရင်းအင်း ပါမောက္ခ ဘင်ဂျမင်ဖြစ်ပြီး သီးသန့် Statorials ဆရာအဖြစ် လှည့်ပတ်ပါသည်။ စာရင်းဇယားနယ်ပယ်တွင် ကျယ်ပြန့်သောအတွေ့အကြုံနှင့် ကျွမ်းကျင်မှုနှင့်အတူ၊ Statorials မှတစ်ဆင့် ကျောင်းသားများကို ခွန်အားဖြစ်စေရန်အတွက် ကျွန်ုပ်၏အသိပညာကို မျှဝေလိုပါသည်။ ပိုသိတယ်။