Matplotlib တွင်မြှားဆွဲနည်း
Matplotlib တွင် မြှားများဆွဲရန်၊ အောက်ပါ syntax ကိုအသုံးပြုသည့် matplotlib.pyplot.arrow လုပ်ဆောင်ချက်ကို အသုံးပြုနိုင်ပါသည် ။
matplotlib.pyplot.arrow(x၊ y၊ dx၊ dy)
ရွှေ-
- x၊ y- မြှားအခြေ၏ x နှင့် y သြဒိနိတ်များ
- dx၊ dy- x နှင့် y လမ်းကြောင်းများရှိ မြှား၏အရှည်
ဤသင်ခန်းစာသည် ဤလုပ်ဆောင်ချက်ကို လက်တွေ့အသုံးပြုခြင်း၏ ဥပမာများစွာကို ပေးပါသည်။
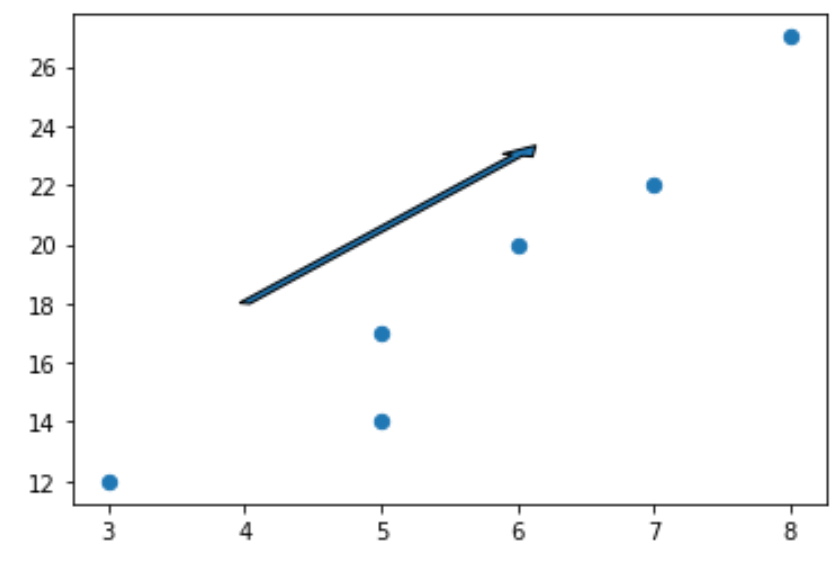
ဥပမာ 1- မြှားတစ်ချက်ဆွဲပါ။
အောက်ဖော်ပြပါကုဒ်သည် Matplotlib ကွက်ပေါ်တွင် မြှားတစ်ချက်ဆွဲနည်းကို ပြသသည်-
 import matplotlib. pyplot as plt

#define two arrays for plotting
A = [3, 5, 5, 6, 7, 8]
B = [12, 14, 17, 20, 22, 27]

#create scatterplot, specifying marker size to be 40
plt. scatter (A, B, s= 40 )

#add arrow to plot
plt. arrow (x= 4 , y= 18 , dx= 2 , dy= 5 , width= .08 )

#displayplot
plt. show ()
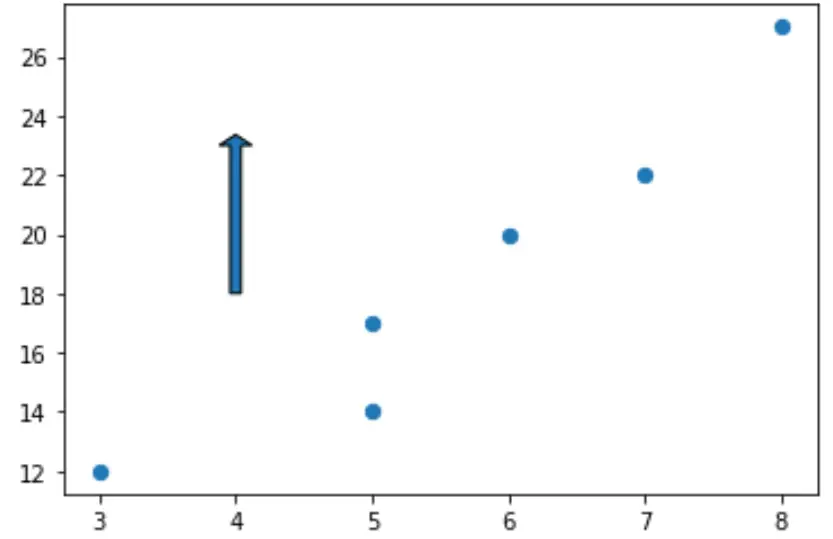
အလျားလိုက်မြှားတစ်ခုဖန်တီးရန် dx=0 ကို ဒေါင်လိုက်မြှားဖန်တီးရန်နှင့် dy=0 ကို သတ်မှတ်နိုင်သည်။
ဥပမာအားဖြင့်၊ ဤသည်မှာ ဒေါင်လိုက်မြှားကို ဖန်တီးနည်းဖြစ်သည်။
 import matplotlib. pyplot as plt

#define two arrays for plotting
A = [3, 5, 5, 6, 7, 8]
B = [12, 14, 17, 20, 22, 27]

#create scatterplot, specifying marker size to be 40
plt. scatter (A, B, s= 40 )

#add arrow to plot
plt. arrow (x= 4 , y= 18 , dx= 0 , dy= 5 , width= .08 )

#displayplot
plt. show ()
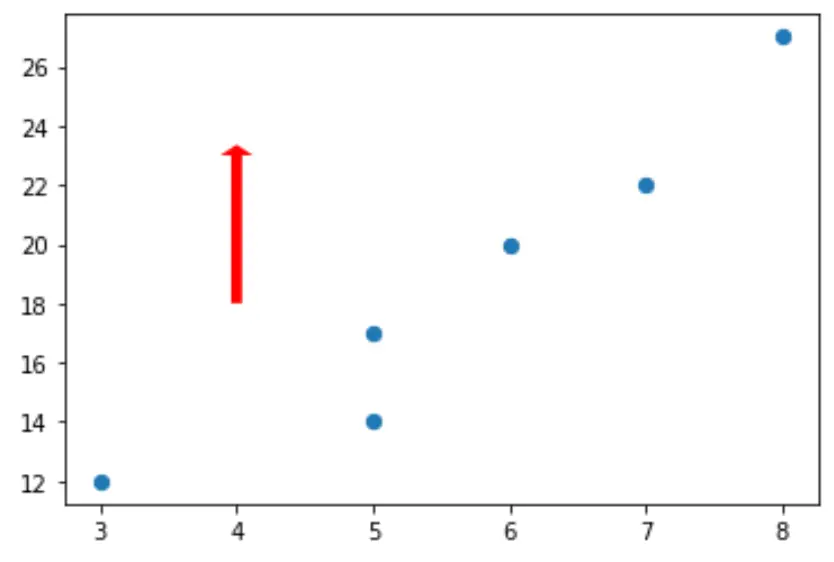
ဥပမာ 2- မြှားပုံစံပြုလုပ်ခြင်း။
မူရင်းအားဖြင့်၊ Matplotlib ရှိ မြှားတစ်စင်းသည် အနက်ရောင်အနားသတ်များဖြင့် အပြာရောင်ဖြစ်နေသော်လည်း ၎င်းကို မျက်နှာအရောင် နှင့် အစွန်းအရောင် အငြင်းအခုံများဖြင့် အလွယ်တကူ ပြောင်းလဲနိုင်သည်-
 import matplotlib. pyplot as plt

#define two arrays for plotting
A = [3, 5, 5, 6, 7, 8]
B = [12, 14, 17, 20, 22, 27]

#create scatterplot, specifying marker size to be 40
plt. scatter (A, B, s= 40 )

#add arrow to plot
plt. arrow (x= 4 , y= 18 , dx= 0 , dy= 5 , width= .08 , facecolor= 'red' , edgecolor= 'none' )

#displayplot
plt. show ()
မြှားများကို ဤနေရာတွင် အသုံးချနိုင်သော စတိုင်ဂုဏ်သတ္တိများ စာရင်းအပြည့်အစုံကို သင်တွေ့နိုင်သည်။
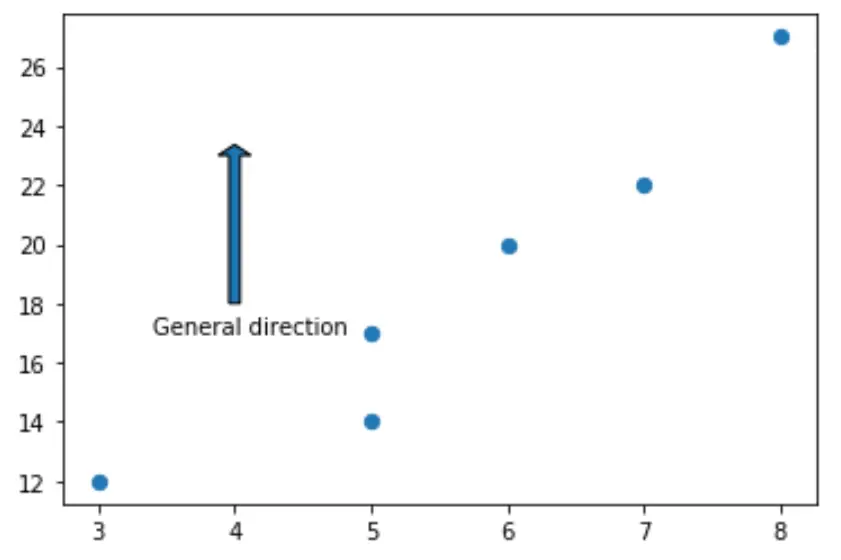
ဥပမာ 3- မြှားများသို့ မှတ်ချက်များထည့်ပါ။
အောက်ပါကုဒ်သည် Matplotlib ကွက်ကွက်ရှိ မြှားတစ်ခုအောက်တွင် မှတ်ချက်တစ်ခုကို ထည့်သွင်းနည်းကို ပြသသည်-
 import matplotlib. pyplot as plt

#define two arrays for plotting
A = [3, 5, 5, 6, 7, 8]
B = [12, 14, 17, 20, 22, 27]

#create scatterplot, specifying marker size to be 40
plt. scatter (A, B, s= 40 )

#add arrow to plot
plt. arrow (x= 4 , y= 18 , dx= 0 , dy= 5 , width= .08 )

#add annotation
plt. annotate (' General direction ', xy = (3.4, 17))

#displayplot
plt. show ()
ထပ်လောင်းအရင်းအမြစ်များ
Matplotlib တွင် စက်ဝိုင်းပုံဆွဲနည်း (ဥပမာများဖြင့်)
Matplotlib တွင် စတုဂံပုံဆွဲနည်း (ဥပမာများဖြင့်)
စာရေးသူအကြောင်း
Benjamin Anderson
မင်္ဂလာပါ၊ ကျွန်ုပ်သည် အငြိမ်းစား စာရင်းအင်း ပါမောက္ခ ဘင်ဂျမင်ဖြစ်ပြီး သီးသန့် Statorials ဆရာအဖြစ် လှည့်ပတ်ပါသည်။ စာရင်းဇယားနယ်ပယ်တွင် ကျယ်ပြန့်သောအတွေ့အကြုံနှင့် ကျွမ်းကျင်မှုနှင့်အတူ၊ Statorials မှတစ်ဆင့် ကျောင်းသားများကို ခွန်အားဖြစ်စေရန်အတွက် ကျွန်ုပ်၏အသိပညာကို မျှဝေလိုပါသည်။ ပိုသိတယ်။