Matplotlib ကွက်များပေါ်တွင် ဂရစ်လိုင်းများပြသနည်း
မူရင်းအားဖြင့်၊ Matplotlib သည် မြေကွက်များပေါ်တွင် gridline များကိုမပြပါ။ သို့သော်၊ သင်သည် ကွက်ကွက်တစ်ခုပေါ်ရှိ gridlines များကို အလွယ်တကူပြသရန်နှင့် စိတ်ကြိုက်ပြင်ဆင်ရန် matplotlib.pyplot.grid() လုပ်ဆောင်ချက်ကို အသုံးပြုနိုင်သည်။
ဤသင်ခန်းစာတွင် ဤလုပ်ဆောင်ချက်ကို လက်တွေ့အသုံးပြုခြင်း၏ ဥပမာကို ပြသထားသည်။
Matplotlib ရှိ အခြေခံ Scatterplot
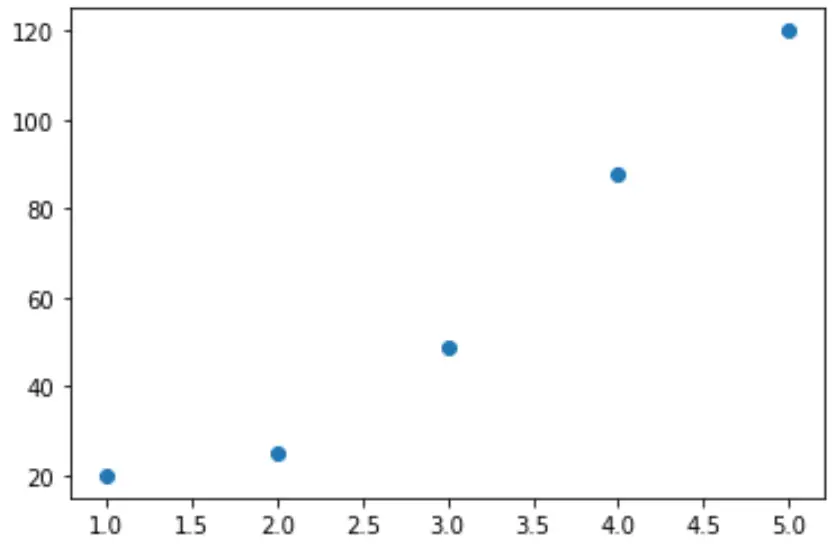
အောက်ပါကုဒ်သည် Matplotlib ကို အသုံးပြု၍ ရိုးရှင်းသော scatterplot ဖန်တီးနည်းကို ပြသသည် ။
 import matplotlib.pyplot as plt

#createdata
x = [1, 2, 3, 4, 5]
y = [20, 25, 49, 88, 120]

#create scatterplot of data
plt. scatter (x,y)
plt. show ()
axes နှစ်ခုလုံးတွင် gridline များထည့်ပါ။
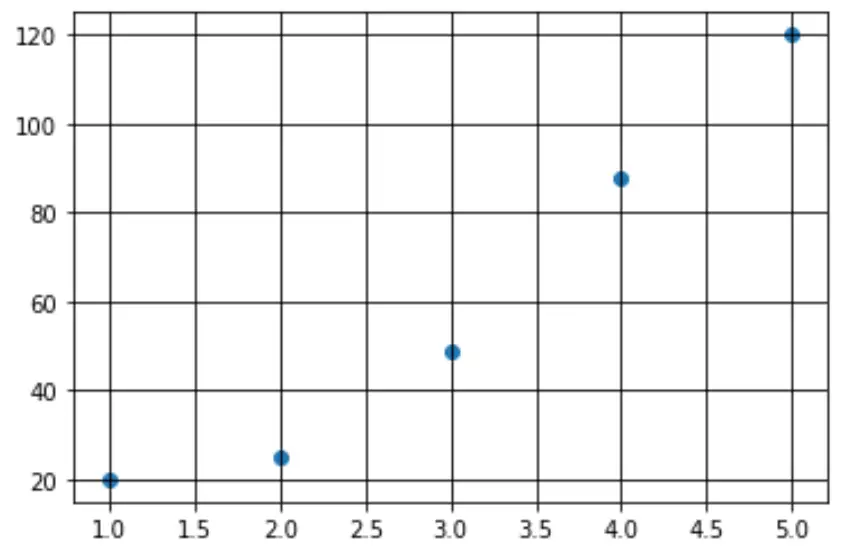
plot တွင် grid တစ်ခုထည့်ရန် plt.grid(True) command ကို ရိုးရိုးရှင်းရှင်း အသုံးပြုနိုင်ပါသည်။
 import matplotlib.pyplot as plt

#create data
x = [1, 2, 3, 4, 5]
y = [20, 25, 49, 88, 120]

#create scatterplot of data with gridlines
plt. scatter (x,y)
plt. grid ( True )
plt. show ()
ဝင်ရိုးတစ်ခုတည်းကို ဇယားကွက်တစ်ခုထည့်ပါ။
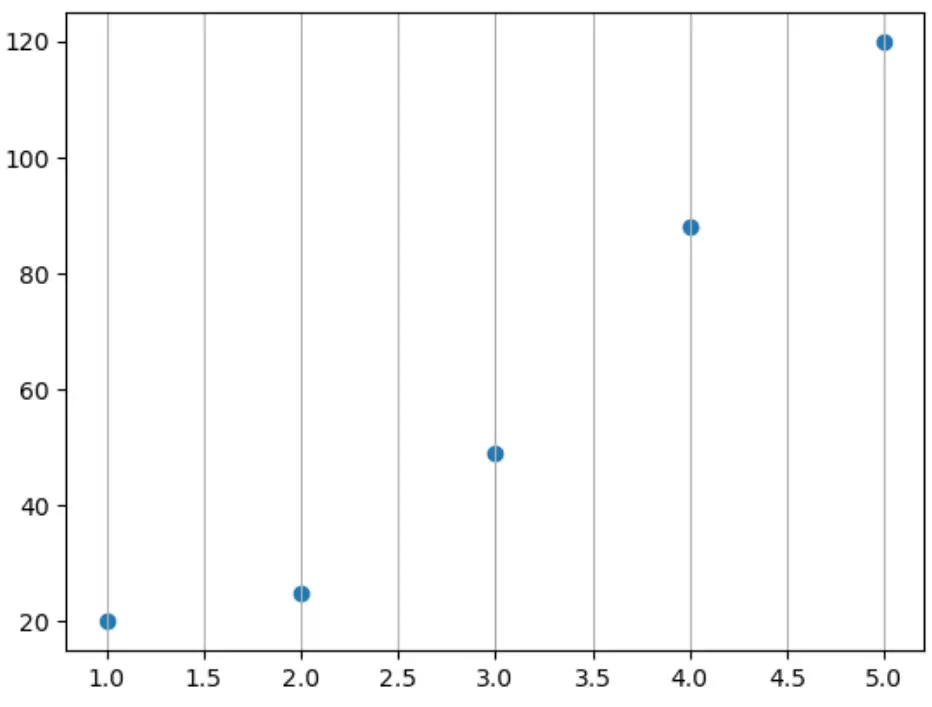
x-axis တွင် gridline တစ်ခုမျှသာထည့်ရန် axis argument ကိုသုံးနိုင်သည်။
 import matplotlib.pyplot as plt

#createdata
x = [1, 2, 3, 4, 5]
y = [20, 25, 49, 88, 120]

#create scatterplot of data with gridlines
plt. scatter (x,y)
plt. grid ( axis=' x ' )
plt. show ()
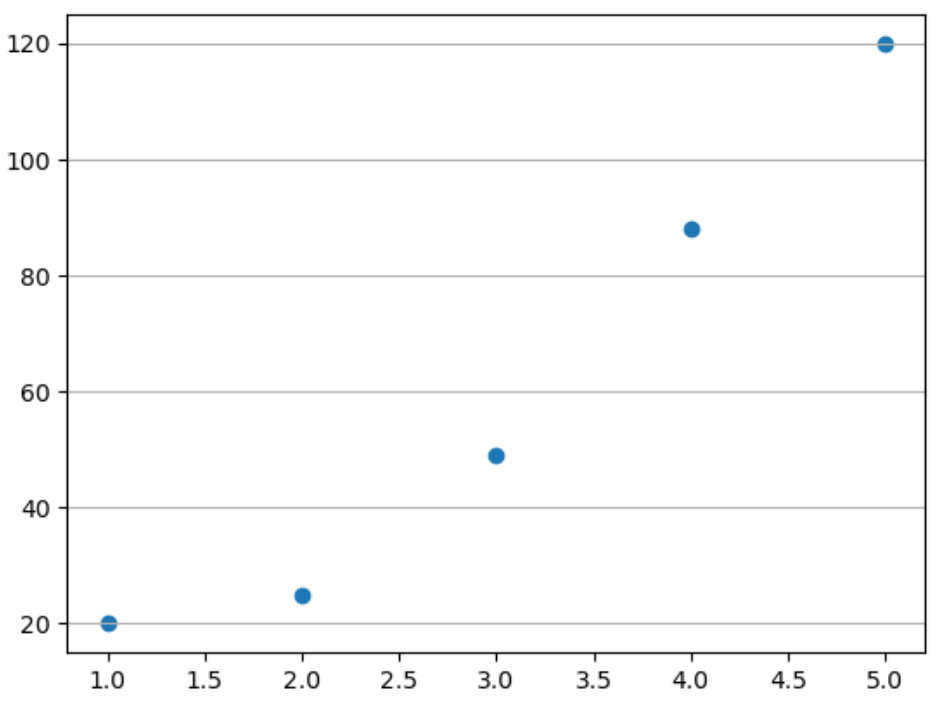
သို့မဟုတ် y ဝင်ရိုးမျှသာဖြစ်သည်-
 import matplotlib.pyplot as plt

#createdata
x = [1, 2, 3, 4, 5]
y = [20, 25, 49, 88, 120]

#create scatterplot of data with gridlines
plt. scatter (x,y)
plt. grid ( axis=' y ' )
plt. show ()
ဇယားကွက်ကို စိတ်ကြိုက်လုပ်ပါ။
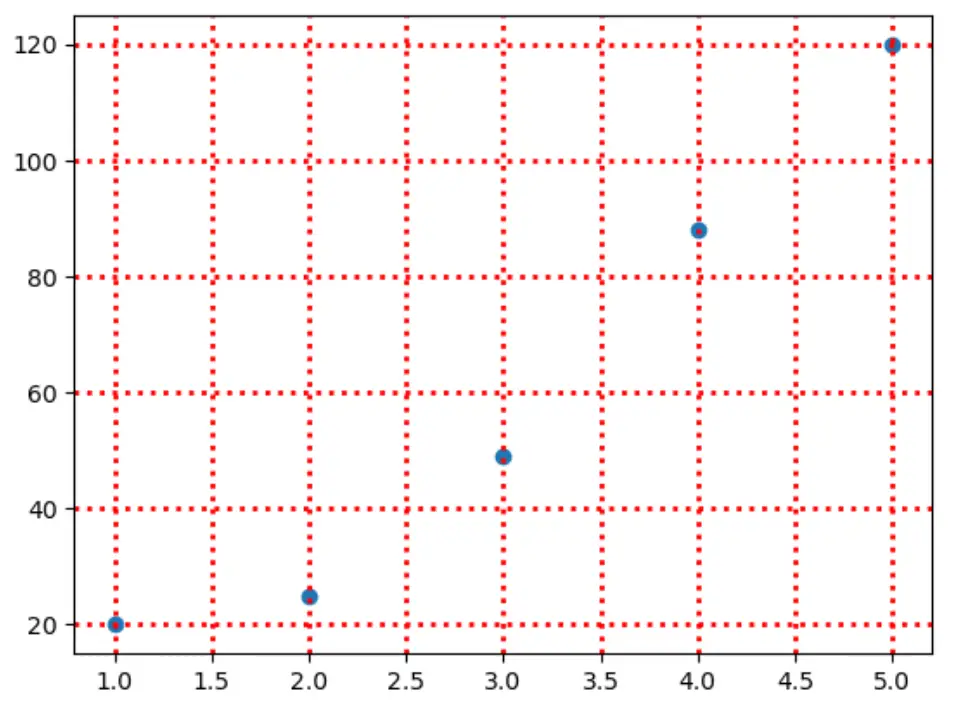
plt.rc() လုပ်ဆောင်ချက်ကို အသုံးပြု၍ ဇယားကွက်၏ အသွင်အပြင်ကိုလည်း စိတ်ကြိုက်ပြင်ဆင်နိုင်သည်-
 import matplotlib.pyplot as plt

#create data
x = [1, 2, 3, 4, 5]
y = [20, 25, 49, 88, 120]

#create scatterplot of data with gridlines
plt. rc (' grid ', linestyle=' : ', color=' red ', linewidth= 2 )
plt. scatter (x,y)
plt. grid ( True )
plt. show ()
Matplotlib documentation တွင် gridlines များကို စိတ်ကြိုက်ပြင်ဆင်ရန် နည်းလမ်းအပြည့်အစုံကို သင်တွေ့နိုင်သည်။
ထပ်လောင်းအရင်းအမြစ်များ
အောက်ပါသင်ခန်းစာများသည် Matplotlib ရှိ အခြားဘုံအလုပ်များကို မည်သို့လုပ်ဆောင်ရမည်ကို ရှင်းပြသည်-
Matplotlib ကွက်များမှ tick များကိုမည်သို့ဖယ်ရှားနည်း
Matplotlib ကွက်တွင် ဖောင့်အရွယ်အစားကို မည်သို့ပြောင်းလဲမည်နည်း။
စာရေးသူအကြောင်း
Benjamin Anderson
မင်္ဂလာပါ၊ ကျွန်ုပ်သည် အငြိမ်းစား စာရင်းအင်း ပါမောက္ခ ဘင်ဂျမင်ဖြစ်ပြီး သီးသန့် Statorials ဆရာအဖြစ် လှည့်ပတ်ပါသည်။ စာရင်းဇယားနယ်ပယ်တွင် ကျယ်ပြန့်သောအတွေ့အကြုံနှင့် ကျွမ်းကျင်မှုနှင့်အတူ၊ Statorials မှတစ်ဆင့် ကျောင်းသားများကို ခွန်အားဖြစ်စေရန်အတွက် ကျွန်ုပ်၏အသိပညာကို မျှဝေလိုပါသည်။ ပိုသိတယ်။