Python တွင် matplotlib ကို အသုံးပြု၍ candlestick chart ဖန်တီးနည်း
ဆီမီးခုံဇယား သည် အချိန်နှင့်အမျှ ငွေရေးကြေးရေး၏ စျေးနှုန်းလှုပ်ရှားမှုများကို ပြသသည့် ဘဏ္ဍာရေးဇယား အမျိုးအစားတစ်ခုဖြစ်သည်။
အောက်ပါဥပမာသည် Python ရှိ Matplotlib အမြင်အာရုံပုံဖော်ခြင်းစာကြည့်တိုက်ကို အသုံးပြု၍ ဆီမီးခုံဇယားကို မည်သို့ဖန်တီးရမည်ကို ပြသထားသည်။
ဥပမာ- Python တွင် Candlestick Chart ဖန်တီးခြင်း။
ကျွန်ုပ်တို့တွင် 8 ရက်တာကာလအတွင်း အချို့သောစတော့ရှယ်ယာတစ်ခု၏ အဖွင့်၊ အပိတ်၊ အမြင့်နှင့် အနိမ့်စျေးနှုန်းများကိုပြသသည့် အောက်ပါပန်ဒါ DataFrame ရှိသည်ဆိုကြပါစို့။
 import pandas as pd

#createDataFrame
prices = pd. DataFrame ({' open ': [25, 22, 21, 19, 23, 21, 25, 29],
                       ' close ': [24, 20, 17, 23, 22, 25, 29, 31],
                       ' high ': [28, 27, 29, 25, 24, 26, 31, 37],
                       ' low ': [22, 16, 14, 17, 19, 18, 22, 26]},
                       index=pd. date_range (" 2021-01-01 ", periods=8, freq=" d "))

#display DataFrame
print (prices)

            open close high low
2021-01-01 25 24 28 22
2021-01-02 22 20 27 16
2021-01-03 21 17 29 14
2021-01-04 19 23 25 17
2021-01-05 23 22 24 19
2021-01-06 21 25 26 18
2021-01-07 25 29 31 22
2021-01-08 29 31 37 26
ဤ 8 ရက်တာကာလအတွင်း ဤစတော့၏စျေးနှုန်းလှုပ်ရှားမှုများကိုမြင်ယောင်ရန် candlestick ဇယားကိုဖန်တီးရန် အောက်ပါကုဒ်ကိုအသုံးပြုနိုင်ပါသည်။
 import matplotlib. pyplot as plt

#create figure
plt. figure ()

#define width of candlestick elements
width = .4
width2 = .05

#define up and down prices
up = prices[prices. close >=prices. open ]
down = prices[prices. close <prices. open ]

#define colors to use
col1 = ' green '
col2 = ' red '

#plot up prices
plt. bar (up. index , up. close -up. open , width, bottom=up. open , color=col1)
plt. bar (up. index ,up. high -up. close ,width2,bottom=up. close ,color=col1)
plt. bar (up. index , up. low -up. open , width2, bottom=up. open , color=col1)

#plot down prices
plt. bar (down. index , down. close -down. open , width, bottom=down. open , color=col2)
plt. bar (down. index , down. high -down. open , width2, bottom=down. open , color=col2)
plt. bar (down. index ,down. low -down. close ,width2,bottom=down. close ,color=col2)

#rotate x-axis tick labels
plt. xticks (rotation= 45 , ha=' right ')

#display candlestick chart
plt. show ()
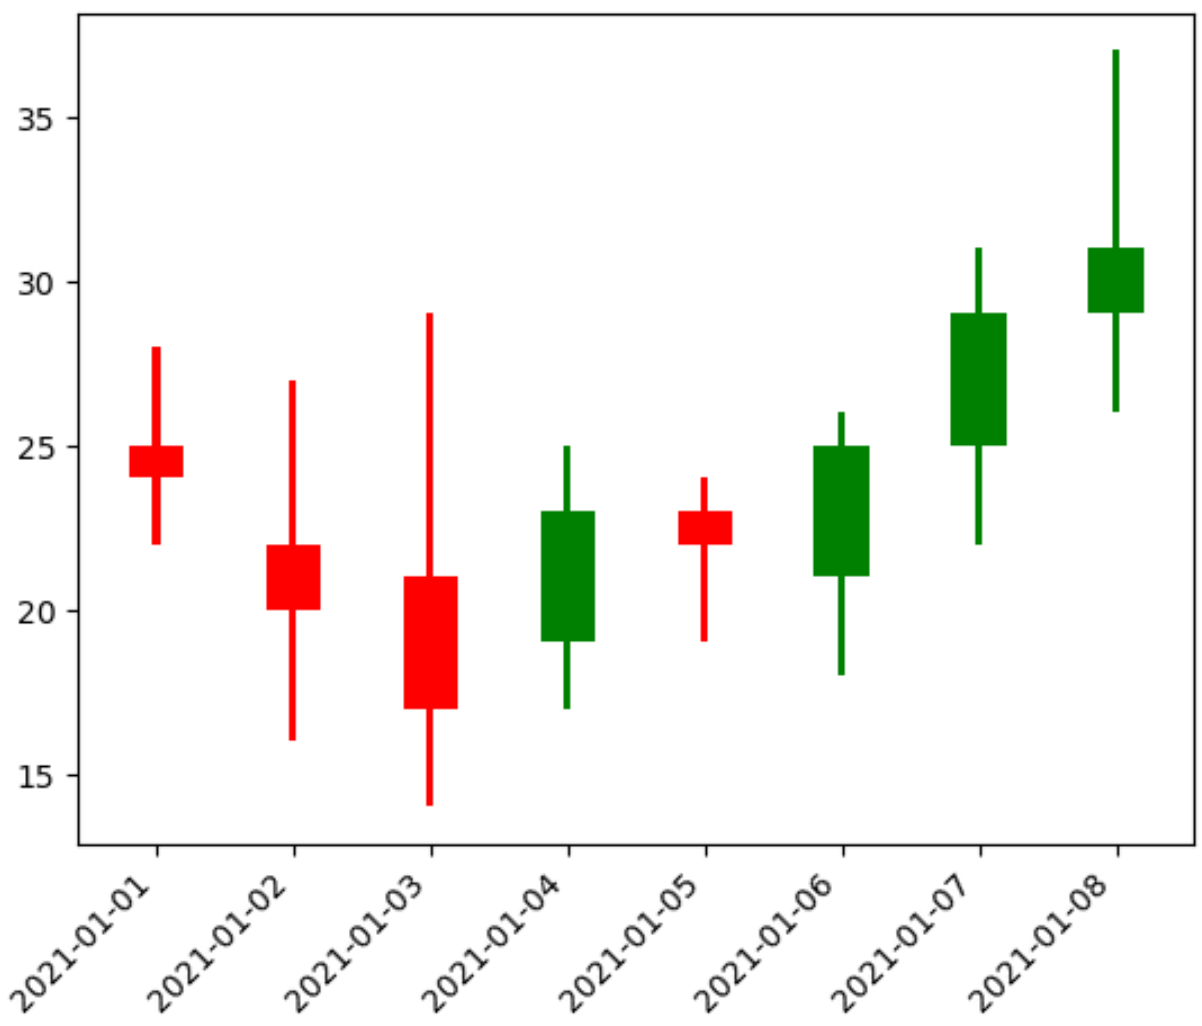
ဆီမီးခုံတစ်ခုစီသည် သတ်မှတ်ထားသောနေ့တွင် လုံခြုံရေး၏စျေးနှုန်းပြောင်းလဲမှုကို ကိုယ်စားပြုသည်။ ဆီမီးခုံ၏အရောင်သည် ယခင်နေ့နှင့်နှိုင်းယှဉ်ပါက စျေးနှုန်းပိုမြင့်ခြင်း (စိမ်း) သို့မဟုတ် အောက် (အနီရောင်) ရှိမရှိကို ပြောပြသည်။
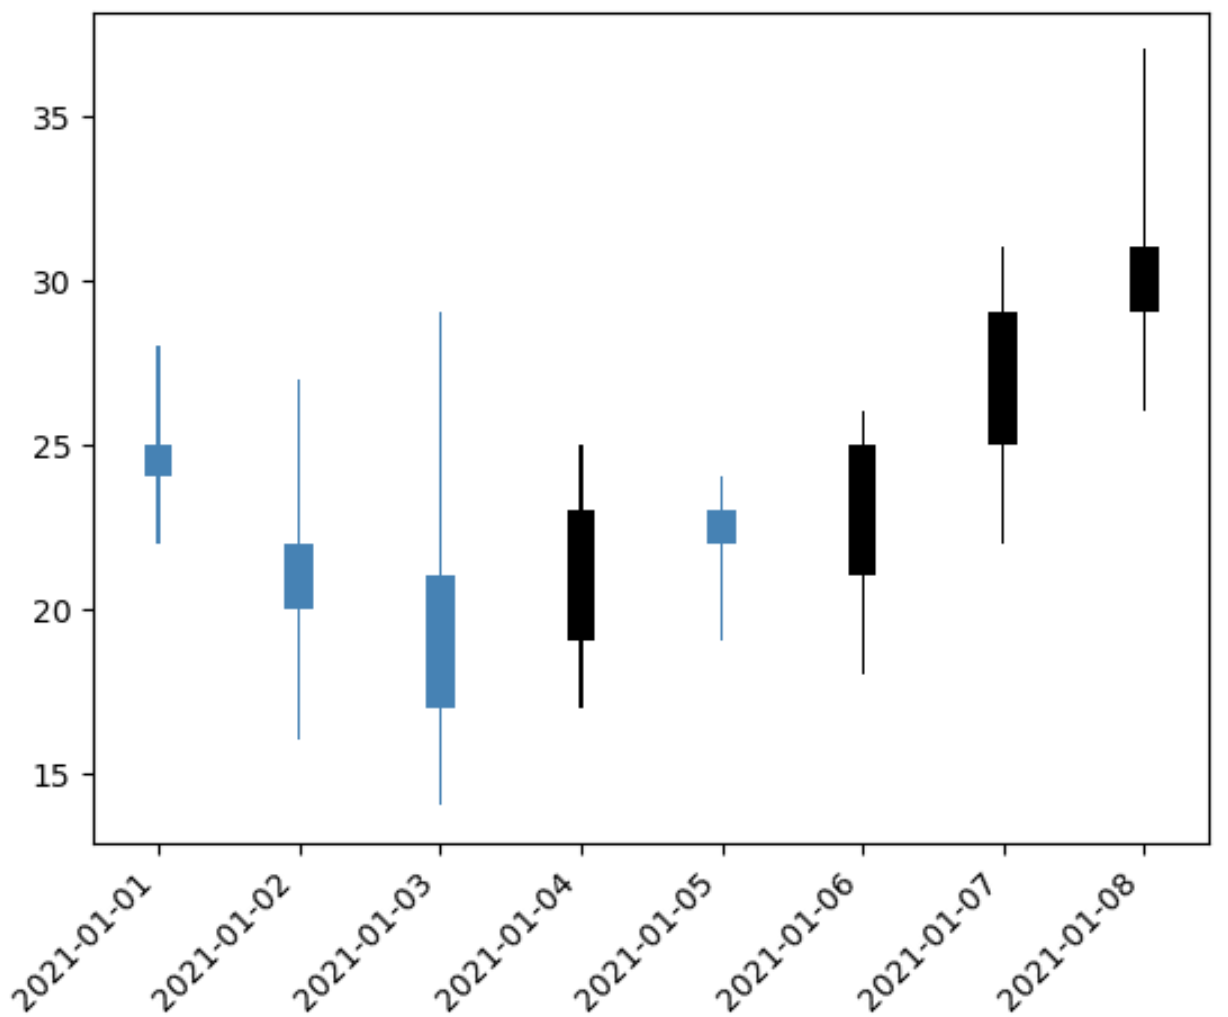
မီးခွက်များ၏ အကျယ်နှင့် ဇယားကွက်ကို သင်အလိုရှိသည့်အတိုင်း ပေါ်လာစေရန် အသုံးပြုသည့် အရောင်များကို လွတ်လပ်စွာ ပြောင်းလဲနိုင်ပါသည်။
ဥပမာအားဖြင့်၊ ကျွန်ုပ်တို့သည် ဖယောင်းတိုင်များကို ပိုမိုပါးလွှာစေပြီး “ မြင့်” နှင့် “ နိမ့်” နေ့များကို ကိုယ်စားပြုရန်အတွက် မတူညီသောအရောင်များကို အသုံးပြုနိုင်ပါသည်။
 import matplotlib. pyplot as plt

#create figure
plt. figure ()

#define width of candlestick elements
width = .2
width2 = .02

#define up and down prices
up = prices[prices. close >=prices. open ]
down = prices[prices. close <prices. open ]

#define colors to use
col1 = ' black '
col2 = ' steelblue '

#plot up prices
plt. bar (up. index , up. close -up. open , width, bottom=up. open , color=col1)
plt. bar (up. index ,up. high -up. close ,width2,bottom=up. close ,color=col1)
plt. bar (up. index , up. low -up. open , width2, bottom=up. open , color=col1)

#plot down prices
plt. bar (down. index , down. close -down. open , width, bottom=down. open , color=col2)
plt. bar (down. index , down. high -down. open , width2, bottom=down. open , color=col2)
plt. bar (down. index ,down. low -down. close ,width2,bottom=down. close ,color=col2)

#rotate x-axis tick labels
plt. xticks (rotation= 45 , ha=' right ')

#display candlestick chart
plt. show ()
ထပ်လောင်းအရင်းအမြစ်များ
အောက်ပါသင်ခန်းစာများသည် Python တွင် အခြားဘုံဇယားများကို ဖန်တီးနည်းကို ရှင်းပြသည်-
ပုံတစ်ခုတည်းတွင် Matplotlib ကွက်များစွာကို ဖန်တီးနည်း
Python ရှိ ဒေတာစာရင်းမှ ဟီစတိုဂရမ်တစ်ခုကို ဘယ်လိုဆွဲမလဲ။
Python တွင် Group အလိုက် Box Plots ဖန်တီးနည်း
စာရေးသူအကြောင်း
Benjamin Anderson
မင်္ဂလာပါ၊ ကျွန်ုပ်သည် အငြိမ်းစား စာရင်းအင်း ပါမောက္ခ ဘင်ဂျမင်ဖြစ်ပြီး သီးသန့် Statorials ဆရာအဖြစ် လှည့်ပတ်ပါသည်။ စာရင်းဇယားနယ်ပယ်တွင် ကျယ်ပြန့်သောအတွေ့အကြုံနှင့် ကျွမ်းကျင်မှုနှင့်အတူ၊ Statorials မှတစ်ဆင့် ကျောင်းသားများကို ခွန်အားဖြစ်စေရန်အတွက် ကျွန်ုပ်၏အသိပညာကို မျှဝေလိုပါသည်။ ပိုသိတယ်။