Matplotlib တွင် ခေါင်းစဉ်အနေအထားကို ချိန်ညှိနည်း
Matplotlib ကွက်ကွက်တစ်ခုရှိ ခေါင်းစဉ်တစ်ခု၏ အနေအထားကို ချိန်ညှိရန် အောက်ပါနည်းလမ်းများထဲမှ တစ်ခုကို အသုံးပြုနိုင်သည်။
 #adjust title position using 'loc' argument (left, center, right)
plt. title (' My Title ', loc=' right ')

#adjust title position using x and y coordinates
plt. title (' My Title ', x= 0.5 , y= 1.1 )
အောက်ဖော်ပြပါ ဥပမာများသည် ဤနည်းလမ်းတစ်ခုစီကို လက်တွေ့အသုံးချနည်းကို ပြသထားသည်။
နည်းလမ်း 1- “ loc” ကို အသုံးပြု၍ ခေါင်းစဉ်အနေအထားကို ချိန်ညှိပါ
အောက်ဖော်ပြပါကုဒ်သည် loc အကြောင်းပြချက်ကို အသုံးပြု၍ Matplotlib ရှိ ခေါင်းစဉ်တစ်ခု၏ အနေအထားကို ချိန်ညှိနည်းကို ပြသသည်။
 import matplotlib. pyplot as plt

#define x and y
x = [1, 4, 10]
y = [5, 9, 27]

#create plot of x and y
plt. plot (x, y)

#add title
plt. title (' My Title ', loc=' left ')
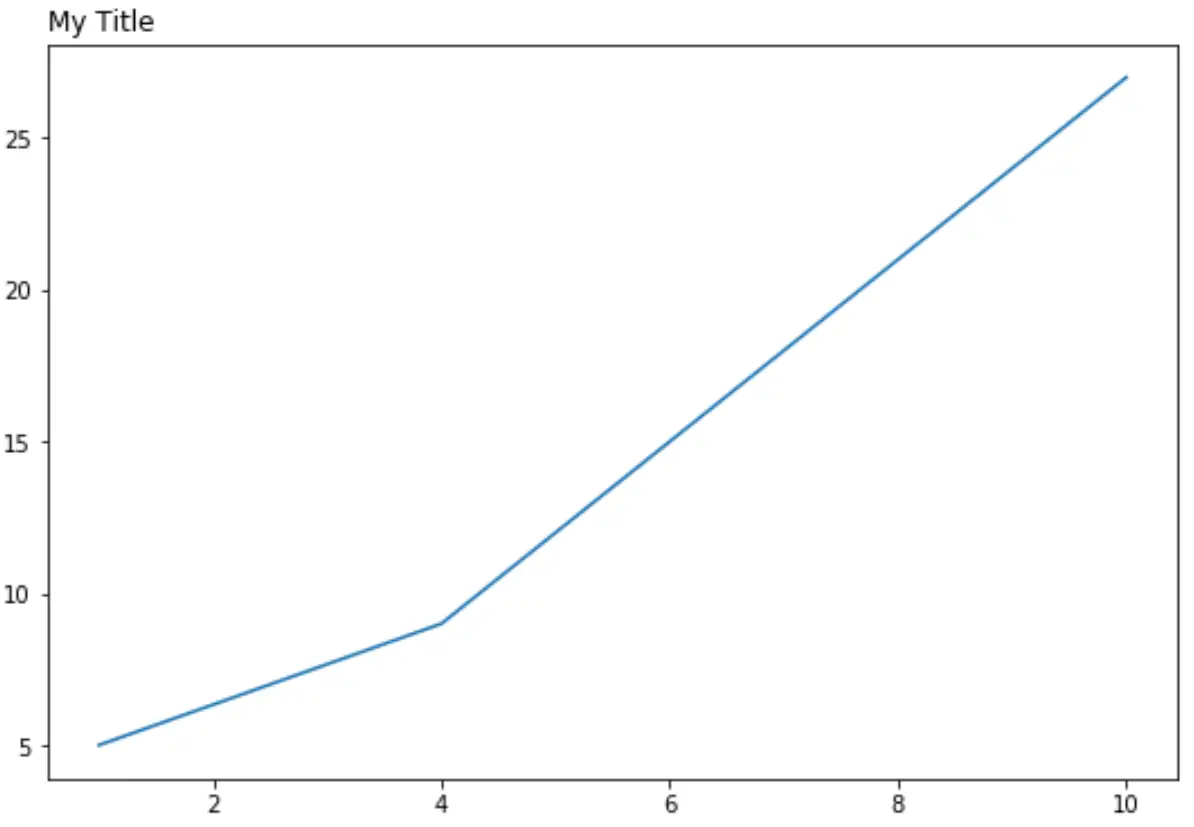
မှတ်ချက်- လက်ဝဲ၊ အလယ် သို့မဟုတ် ညာဘက်တွင် ရာထူးသုံးရပ်အနက်မှ တစ်ခုကို သတ်မှတ်ရန် သင်သည် loc အငြင်းအခုံကို အသုံးပြုနိုင်သည်။ မူလအနေအထားသည် ဗဟိုဖြစ်သည်။
နည်းလမ်း 2- (x၊y) သြဒိနိတ်များကို အသုံးပြု၍ ခေါင်းစဉ်အနေအထားကို ချိန်ညှိပါ။
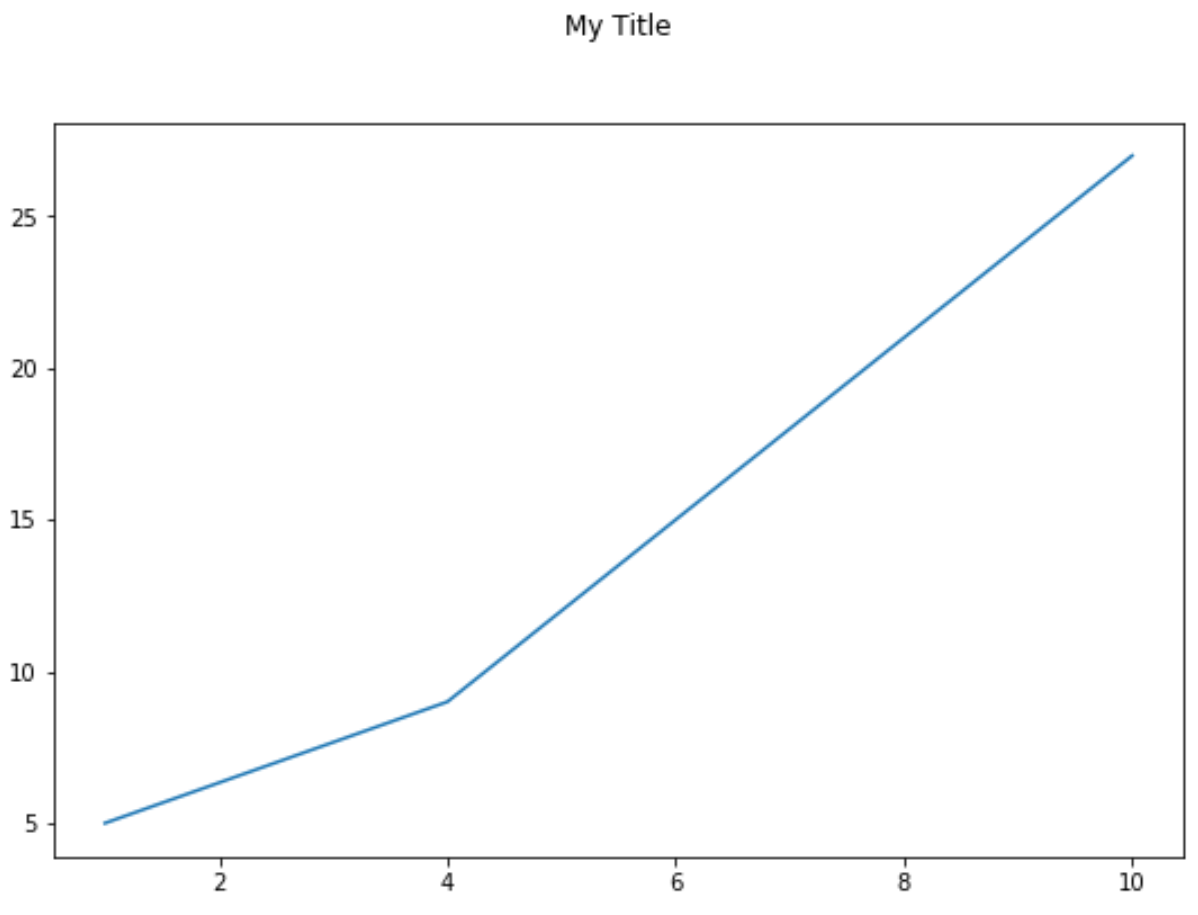
အောက်ပါကုဒ်သည် x နှင့် y သြဒိနိတ်များကို အသုံးပြု၍ Matplotlib ရှိ ခေါင်းစဉ်တစ်ခု၏ အနေအထားကို ချိန်ညှိနည်းကို ပြသသည်။
 import matplotlib. pyplot as plt

#define x and y
x = [1, 4, 10]
y = [5, 9, 27]

#create plot of x and y
plt. plot (x, y)

#add title
plt. title (' My Title ', x= 0.5 , y= 1.1 )
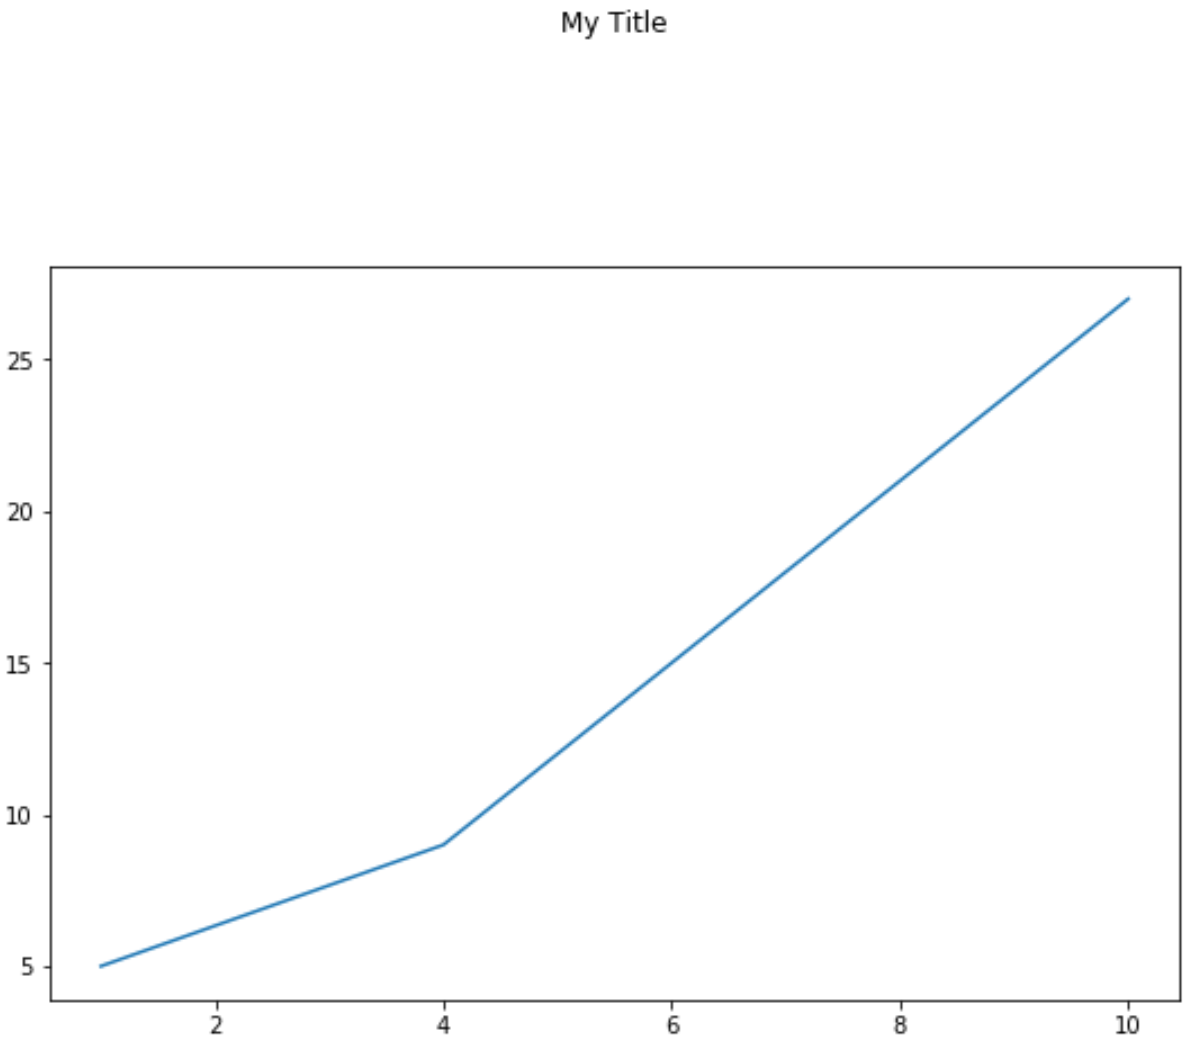
သြဒိနိတ်များထဲမှ တစ်ခုကို ရိုးရှင်းစွာ သတ်မှတ်ရန်လည်း သင်ရွေးချယ်နိုင်သည်။ ဥပမာအားဖြင့်၊ သင်သည် y သြဒိနိတ်ကိုသာ သတ်မှတ်နိုင်သည်-
 import matplotlib. pyplot as plt

#define x and y
x = [1, 4, 10]
y = [5, 9, 27]

#create plot of x and y
plt. plot (x, y)

#add title
plt. title (' My Title ', y= 1.3 )
ထပ်လောင်းအရင်းအမြစ်များ
Matplotlib တွင် ကွက်ကွက်အရွယ်အစားကို မည်သို့တိုးမည်နည်း။
Matplotlib တွင် ဝင်ရိုးအပိုင်းအခြားများ သတ်မှတ်နည်း
Matplotlib တွင် X ဝင်ရိုးတန်ဖိုးများသတ်မှတ်နည်း
Matplotlib ရှိ tick အရေအတွက်ကို ဘယ်လိုပြောင်းမလဲ။
စာရေးသူအကြောင်း
Benjamin Anderson
မင်္ဂလာပါ၊ ကျွန်ုပ်သည် အငြိမ်းစား စာရင်းအင်း ပါမောက္ခ ဘင်ဂျမင်ဖြစ်ပြီး သီးသန့် Statorials ဆရာအဖြစ် လှည့်ပတ်ပါသည်။ စာရင်းဇယားနယ်ပယ်တွင် ကျယ်ပြန့်သောအတွေ့အကြုံနှင့် ကျွမ်းကျင်မှုနှင့်အတူ၊ Statorials မှတစ်ဆင့် ကျောင်းသားများကို ခွန်အားဖြစ်စေရန်အတွက် ကျွန်ုပ်၏အသိပညာကို မျှဝေလိုပါသည်။ ပိုသိတယ်။