Matplotlib ဖြင့် ဇယားတစ်ခုဖန်တီးနည်း
Matplotlib ကို အသုံးပြု၍ Python တွင် ဇယားများဖန်တီးရန် အောက်ပါနည်းလမ်းနှစ်ခုမှ တစ်ခုခုကို သင်အသုံးပြုနိုင်သည်-
နည်းလမ်း 1- pandas DataFrame မှဇယားတစ်ခုဖန်တီးပါ။
 #create pandas DataFrame
df = pd.DataFrame(np. random . randn (20, 2), columns=[' First ', ' Second '])

#create table
table = ax. table (cellText=df. values , colLabels=df. columns , loc=' center ')
နည်းလမ်း 2- စိတ်ကြိုက်တန်ဖိုးများမှ array တစ်ခုကို ဖန်တီးပါ။
 #create values for table
table_data=[
    ["Player 1", 30],
    ["Player 2", 20],
    ["Player 3", 33],
    ["Player 4", 25],
    ["Player 5", 12]
]

#create table
table = ax. table (cellText=table_data, loc=' center ')
ဤသင်ခန်းစာတွင် ဤနည်းလမ်းများကို လက်တွေ့အသုံးချနည်းနမူနာများကို ပေးထားပါသည်။
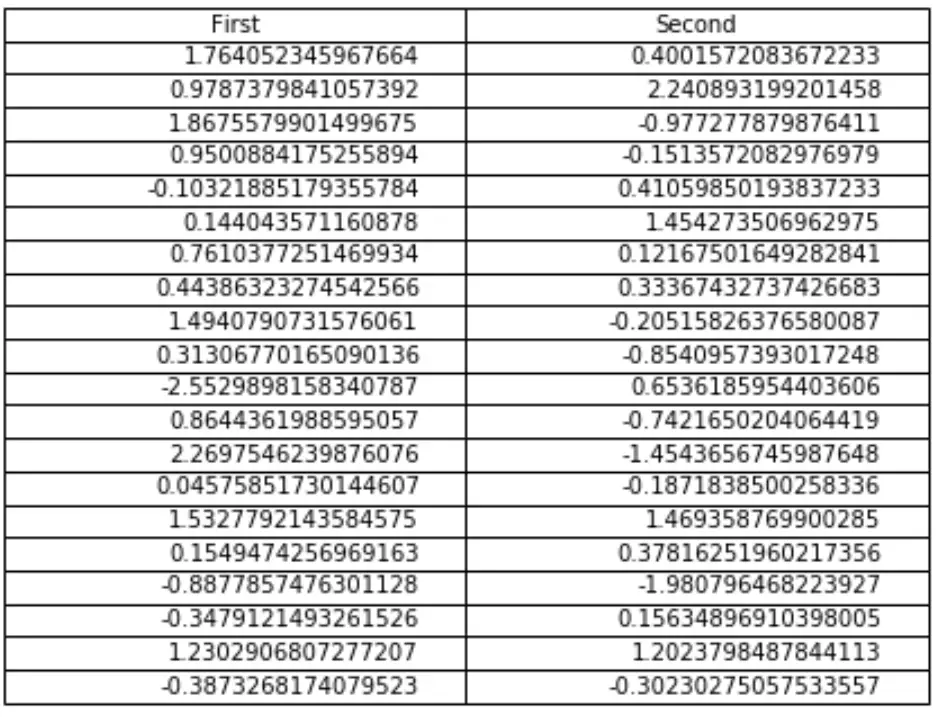
ဥပမာ 1- pandas DataFrame မှ ဇယားတစ်ခုကို ဖန်တီးပါ။
အောက်ပါကုဒ်သည် ပန်ဒါဒေတာဘောင်၏ တန်ဖိုးများပါရှိသော Matplotlib တွင် ဇယားတစ်ခုကို မည်သို့ဖန်တီးရမည်ကို ပြသသည်-
 import numpy as np
import pandas as pd
import matplotlib.pyplot as plt

#make this example reproducible
n.p. random . seeds (0)

#define figure and axes
fig, ax = plt. subplots ()

#hide the axes
fig.patch. set_visible (False)
ax.axis(' off ')
ax.axis(' tight ')

#createdata
df = pd.DataFrame(np. random . randn (20, 2), columns=[' First ', ' Second '])

#create table
table = ax. table (cellText=df.values, colLabels=df.columns, loc=' center ')

#display table
fig. tight_layout ()
plt. show ()
ဥပမာ 2- စိတ်ကြိုက်တန်ဖိုးများမှ ဇယားတစ်ခုကို ဖန်တီးပါ။
အောက်ပါကုဒ်သည် စိတ်ကြိုက်တန်ဖိုးများပါဝင်သော Matplotlib တွင် ဇယားတစ်ခုဖန်တီးနည်းကို ပြသသည်-
 import numpy as np
import pandas as pd
import matplotlib.pyplot as plt

#define figure and axes
fig, ax = plt. subplots ()

#create values for table
table_data=[
    ["Player 1", 30],
    ["Player 2", 20],
    ["Player 3", 33],
    ["Player 4", 25],
    ["Player 5", 12]
]

#create table
table = ax. table (cellText=table_data, loc=' center ')

#modify table
table. set_fontsize (14)
table. scale (1.4)
ax. axis (' off ')

#displaytable
plt. show ()
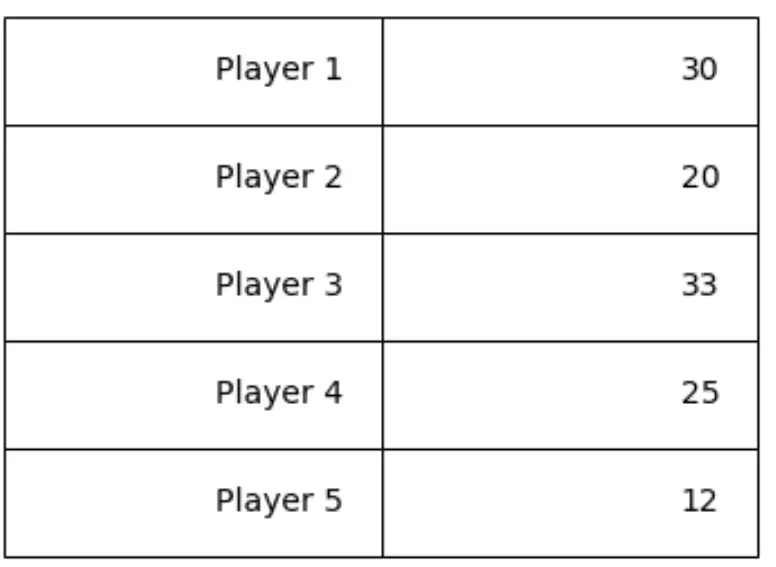
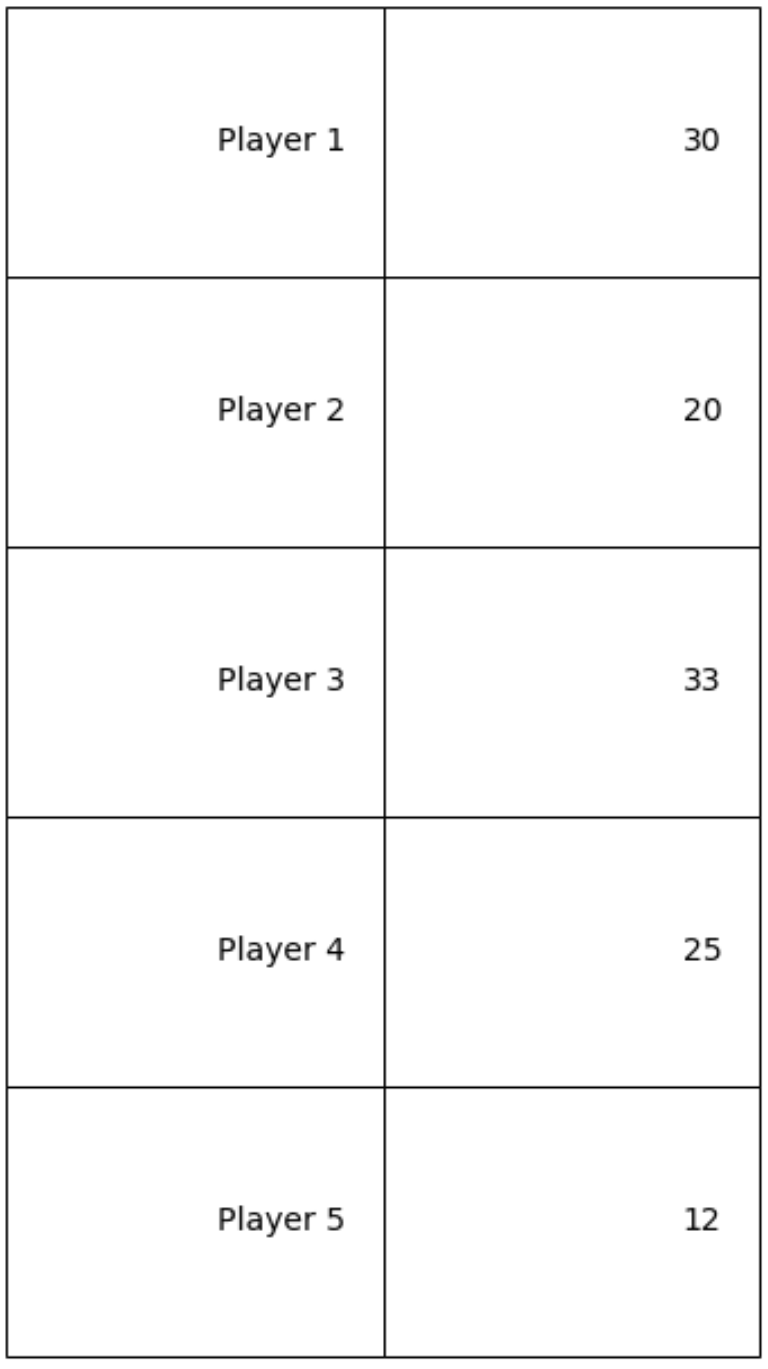
table.scale(width, length) သည် table ၏ width နှင့် length ကို ပြောင်းလဲပေးသည်ကို သတိပြုပါ။ ဥပမာအားဖြင့်၊ အရှည်ကိုပြောင်းခြင်းဖြင့် ဇယားကို ပိုရှည်အောင်လုပ်နိုင်သည်-
table. scale (1.10)
ထပ်လောင်းအရင်းအမြစ်များ
Matplotlib ကွက်များသို့ စာသားထည့်နည်း
Matplotlib တွင် ရှုထောင့်အချိုးကို မည်သို့သတ်မှတ်မည်နည်း။
Matplotlib တွင် ဒဏ္ဍာရီဖောင့်အရွယ်အစားကို မည်သို့ပြောင်းလဲမည်နည်း။
စာရေးသူအကြောင်း
Benjamin Anderson
မင်္ဂလာပါ၊ ကျွန်ုပ်သည် အငြိမ်းစား စာရင်းအင်း ပါမောက္ခ ဘင်ဂျမင်ဖြစ်ပြီး သီးသန့် Statorials ဆရာအဖြစ် လှည့်ပတ်ပါသည်။ စာရင်းဇယားနယ်ပယ်တွင် ကျယ်ပြန့်သောအတွေ့အကြုံနှင့် ကျွမ်းကျင်မှုနှင့်အတူ၊ Statorials မှတစ်ဆင့် ကျောင်းသားများကို ခွန်အားဖြစ်စေရန်အတွက် ကျွန်ုပ်၏အသိပညာကို မျှဝေလိုပါသည်။ ပိုသိတယ်။