Matplotlib တွင် ဒဏ္ဍာရီတစ်ခုကို မည်ကဲ့သို့ ဖယ်ရှားနည်း (ဥပမာများဖြင့်)
Matplotlib ရှိ ဇာတ်ကွက်တစ်ခုမှ ဒဏ္ဍာရီတစ်ခုကို ဖယ်ရှားရန် အောက်ပါအခြေခံ syntax ကို သင်အသုံးပြုနိုင်သည်-
 import matplotlib. pyplot as plt

plt. legend ('', frameon= False )
‘ ‘ ကိုးကားချက်များသည် Matplotlib သည် ဒဏ္ဍာရီတွင် မည်သည့်ကိန်းရှင်များကိုမျှ မထားရှိရန် Matplotlib အား ပြောထားပြီး frameon argument သည် ဒဏ္ဍာရီတစ်ဝိုက်ရှိ frame ကို ဖယ်ရှားရန် Matplotlib အား ပြောထားသည်။
အောက်ဖော်ပြပါ ဥပမာသည် ဤ syntax ကို လက်တွေ့တွင် မည်သို့အသုံးပြုရမည်ကို ပြသထားသည်။
ဥပမာ- Matplotlib ရှိ ဒဏ္ဍာရီတစ်ခုကို ဖျက်ပါ။
အမျိုးမျိုးသော ဘတ်စကတ်ဘောကစားသမားများအကြောင်း အချက်အလက်ပါရှိသော အောက်ပါပန်ဒါ DataFrame ရှိသည်ဆိုပါစို့။
 import pandas as pd

#createDataFrame
df = pd. DataFrame ({' team ': ['A', 'A', 'A', 'A', 'B', 'B', 'B', 'B'],
                   ' position ': ['G', 'G', 'F', 'F', 'G', 'F', 'F', 'F'],
                   ' points ': [5, 7, 7, 9, 12, 9, 9, 4]})

#view DataFrame
print (df)

  team position points
0 AG 5
1 AG 7
2AF 7
3 AF 9
4 BG 12
5 BF 9
6 BF 9
7 BF 4
အသင်းနှင့်ရာထူးတစ်ခုစီရှိ ကစားသမားများမှ ရမှတ်စုစုပေါင်းရမှတ်များကို မြင်သာစေရန် တန်းစီထားသော ဘားဇယားတစ်ခုဖန်တီးရန် အောက်ပါကုဒ်ကို အသုံးပြုနိုင်ပါသည်။
 import matplotlib. pyplot as plt

#create stacked bar chart
df. groupby ([' team ', ' position ']). size (). unstack (). plot (kind=' bar ', stacked= True )
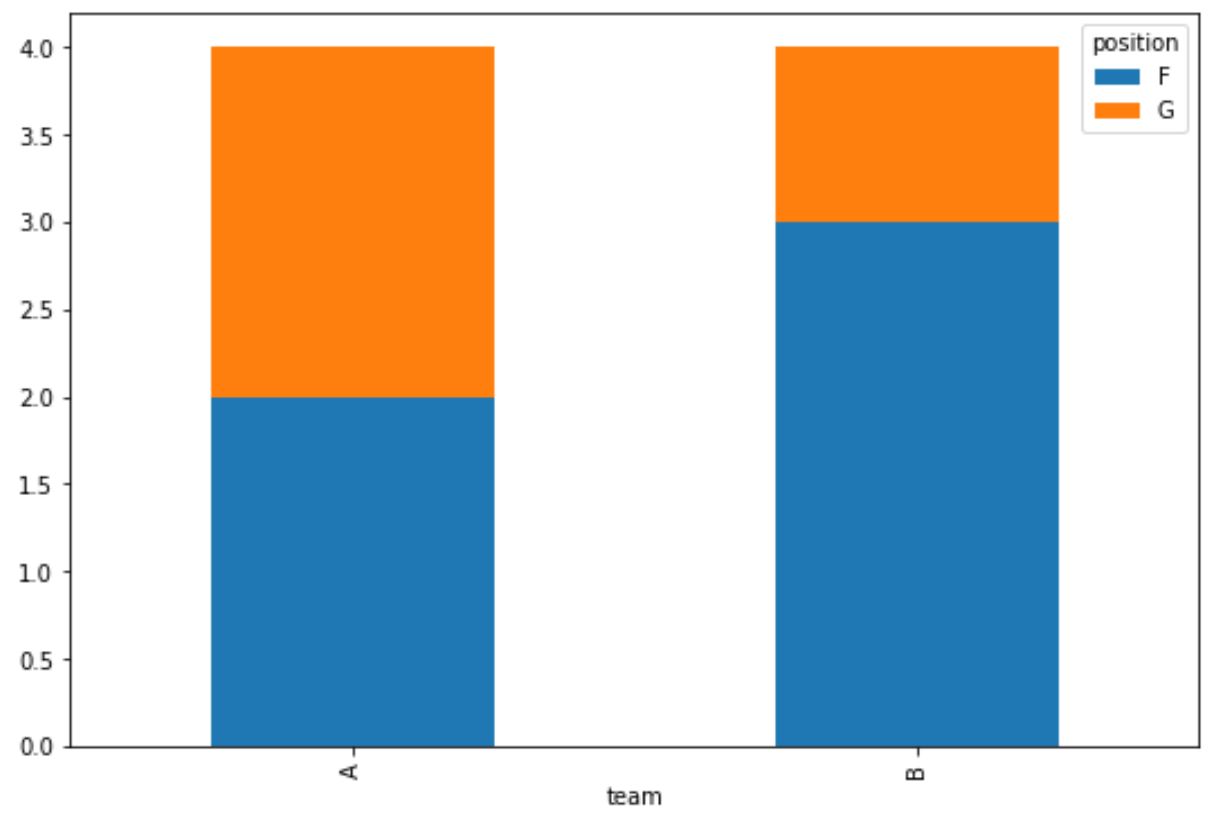
Matplotlib သည် မူရင်းအတိုင်း ညာဘက်အပေါ်ထောင့်တွင် ဒဏ္ဍာရီတစ်ခုကို နေရာချထားကြောင်း သတိပြုပါ။
ဒဏ္ဍာရီမပါဘဲ ဤတူညီသောဇာတ်ကွက်ကို ဖန်တီးရန်၊ သင်သည် အောက်ပါကုဒ်ကို အသုံးပြုနိုင်သည်။
 import matplotlib. pyplot as plt

#create stacked bar chart
df. groupby ([' team ', ' position ']). size (). unstack (). plot (kind=' bar ', stacked= True )

#remove legend
plt. legend ('', frameon= False )
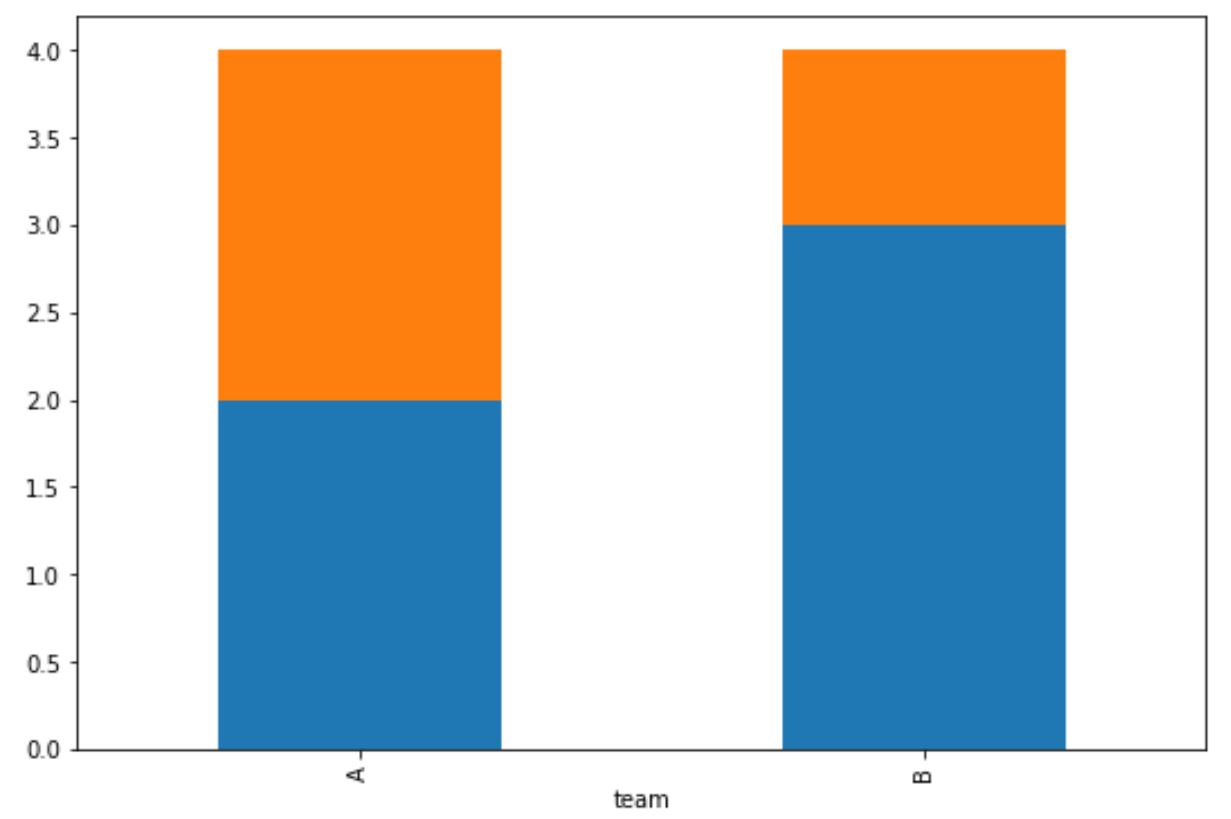
ဤအစီအစဥ်ပြထားသော ဘားဇယားသည် ယခင်ဇယားနှင့် ကိုက်ညီသော်လည်း ဒဏ္ဍာရီကို ဖယ်ရှားလိုက်ပါပြီ။
Matplotlib ရှိ မည်သည့်ဇာတ်ကွက်မှ ဒဏ္ဍာရီတစ်ခုကို ဖယ်ရှားရန် တူညီသော syntax ကို အသုံးပြုနိုင်ကြောင်းကိုလည်း သတိပြုပါ။
ဥပမာအားဖြင့်၊ အောက်ပါကုဒ်သည် Matplotlib တွင် အဝိုင်းပုံဇယားကို ဖန်တီးပြီး ဒဏ္ဍာရီကို ဖယ်ရှားနည်းကို ပြသသည်-
 import matplotlib. pyplot as plt

#create pie chart that shows total points scored by team
df. groupby ([' team ']). sum (). plot (kind=' pie ', y=' points ')

#remove legend
plt. legend ('', frameon= False )
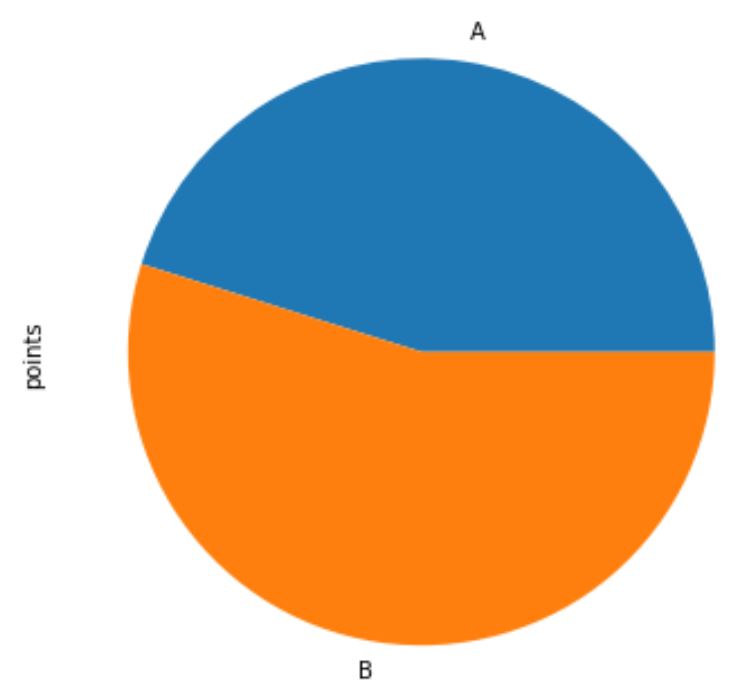
ရလဒ်မှာ ဒဏ္ဍာရီမပါဘဲ အဝိုင်းပုံစံဇယားတစ်ခုဖြစ်သည်။
ထပ်လောင်းအရင်းအမြစ်များ
အောက်ပါသင်ခန်းစာများသည် Matplotlib ရှိ အခြားဘုံအလုပ်များကို မည်သို့လုပ်ဆောင်ရမည်ကို ရှင်းပြသည်-
Matplotlib ကွက်များမှ tick များကိုမည်သို့ဖယ်ရှားနည်း
Matplotlib ကွက်တွင် ဖောင့်အရွယ်အစားကို မည်သို့ပြောင်းလဲမည်နည်း။
Matplotlib တွင် ပျမ်းမျှမျဉ်းကြောင်းထည့်နည်း
စာရေးသူအကြောင်း
Benjamin Anderson
မင်္ဂလာပါ၊ ကျွန်ုပ်သည် အငြိမ်းစား စာရင်းအင်း ပါမောက္ခ ဘင်ဂျမင်ဖြစ်ပြီး သီးသန့် Statorials ဆရာအဖြစ် လှည့်ပတ်ပါသည်။ စာရင်းဇယားနယ်ပယ်တွင် ကျယ်ပြန့်သောအတွေ့အကြုံနှင့် ကျွမ်းကျင်မှုနှင့်အတူ၊ Statorials မှတစ်ဆင့် ကျောင်းသားများကို ခွန်အားဖြစ်စေရန်အတွက် ကျွန်ုပ်၏အသိပညာကို မျှဝေလိုပါသည်။ ပိုသိတယ်။